For those who want to roll the dice on deflated public enterprises with proven upside potential, it’s difficult to overlook Nio (NIO). At first glance, NIO stock doesn’t seem particularly compelling, with the Barchart Technical Opinion indicator rating the security as a 24% Weak Sell. Not really helping matters is its near-term performance. In the trailing month, the electric vehicle manufacturer slipped 25%.
Adding to some of the brewing concerns, the options market isn’t exactly providing a comforting read for the bulls. Specifically, options flow — which focuses exclusively on big block transactions likely placed by institutional investors — showed pensive transactions this week. For example, on Monday, net trade sentiment fell $124,200 below parity. On the following day, this metric was down $1,300 below zero.
These stats aren’t necessarily alarming, to be fair. However, they also demonstrate that, at least for this week, there hasn’t been much optimism revealed by smart money traders.
Still, it’s almost certain that retail will eventually perceive an opportunity here. Since the beginning of January, NIO stock has gained more than 15% of value — even accounting for the recent implosion in market capitalization.
This phenomenon of collective intuiting of opportunity is known as reflexivity — and measuring its impact yields critical intelligence.
Pivoting Toward Distributional Analysis of NIO Stock
One of the most common mechanisms of analyzing public securities is to view price as a function of time. It’s the most intuitive perspective that we as humans have so it represents a solid foundation. However, this process also leads to event-based calculations, which must be carefully calibrated in order to yield sound results.
For example, if a company delivered rare blockbuster earnings, its stock performance for that week will likely be incredibly robust. If an analyst didn’t control for that aberrant behavior, it becomes very easy to draw erroneous conclusions. However, if that one week’s worth of data merely represented one of many weeks, in a distributional analysis, one-off aberrations would effectively be neutralized.
Significantly, though, while distributional analyses mitigate the impact of rare events, they raise the profile of consistent behaviors. In other words, across a time-fixed distribution, certain price points will be triggered more than others — much like tire marks mostly accumulate on the center of the lane as opposed to the periphery.
In scientific contexts, the above dynamic is known as probability density. As equities market traders, knowing where a security is most likely to cluster at a given point in time represents a massive advantage, as I’m sure you’ll agree.
Of course, NIO stock — just like any other security — represents a singular journey across time. As such, this format doesn’t lend itself organically to probabilistic frameworks. However, by changing the format into a discretized, frequentist approach, we can categorize different price structures and their associated forward behaviors.
Following the formatting change — where we distributionally plot probability density as a function of price — we can isolate the current quantitative signal and estimate (from past analogs) where NIO stock is likely to end up.
Ultimately, while we can’t know the cause of reflexivity, we can measure when it’s likely to materialize — and just how far the catalyst typically moves the stock.
Applying Data Science for the Real World
Using the above probabilistic methodology, the forward 10-week returns of NIO stock can be arranged as a distributional curve, with median outcomes mostly ranging between $4.40 and $5.25 (assuming an anchor price of $5.03, Wednesday’s close). Further, price clustering would likely be predominant at around $4.92.
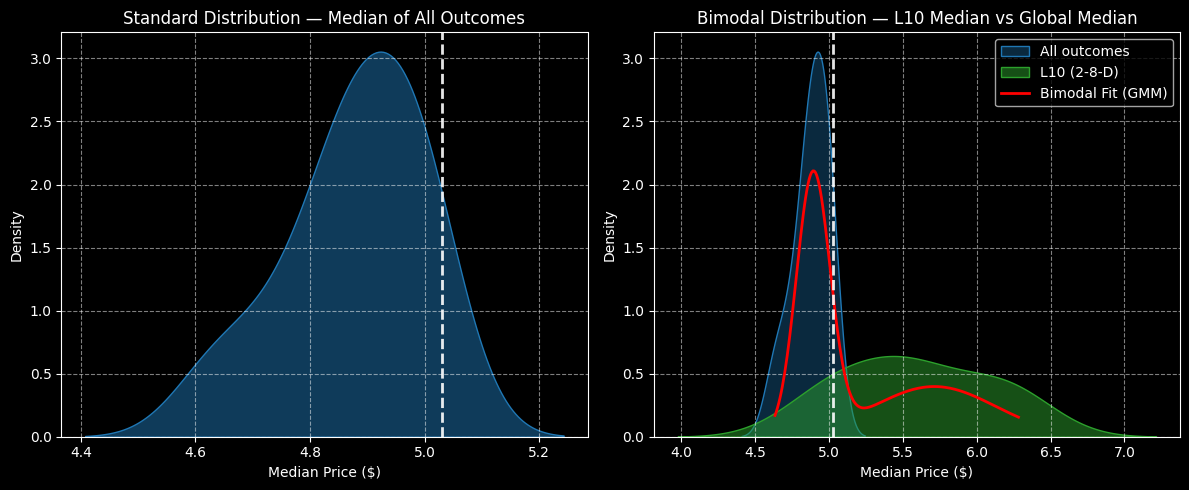
The above assessment aggregates all rolling 10-week trials that have occurred since January 2019. However, we’re interested in isolating for the current quantitative signal, which is the 2-8-D sequence; that is, in the trailing 10 weeks, NIO stock printed two up weeks and eight down weeks, with an overall downward slope.
Under this setup, the forward 10-week returns shift quite dramatically, with median outcomes ranging mostly between $4 and $7.40. Moreover, price clustering would likely be predominant around $5.45. That means there’s a 10.77% positive variance between the two clusters, which is quite a robust structural arbitrage.
Statistically, though, the biggest takeaway is that probabilistic mass is densest between $5 and $6. From $6 to $6.50, probability density drops by 51.37%. And from $6.50 to $7, density plunges by 93.58%. Therefore, by understanding the risk geometry of NIO stock, the most statistically viable options strategy almost sells itself.
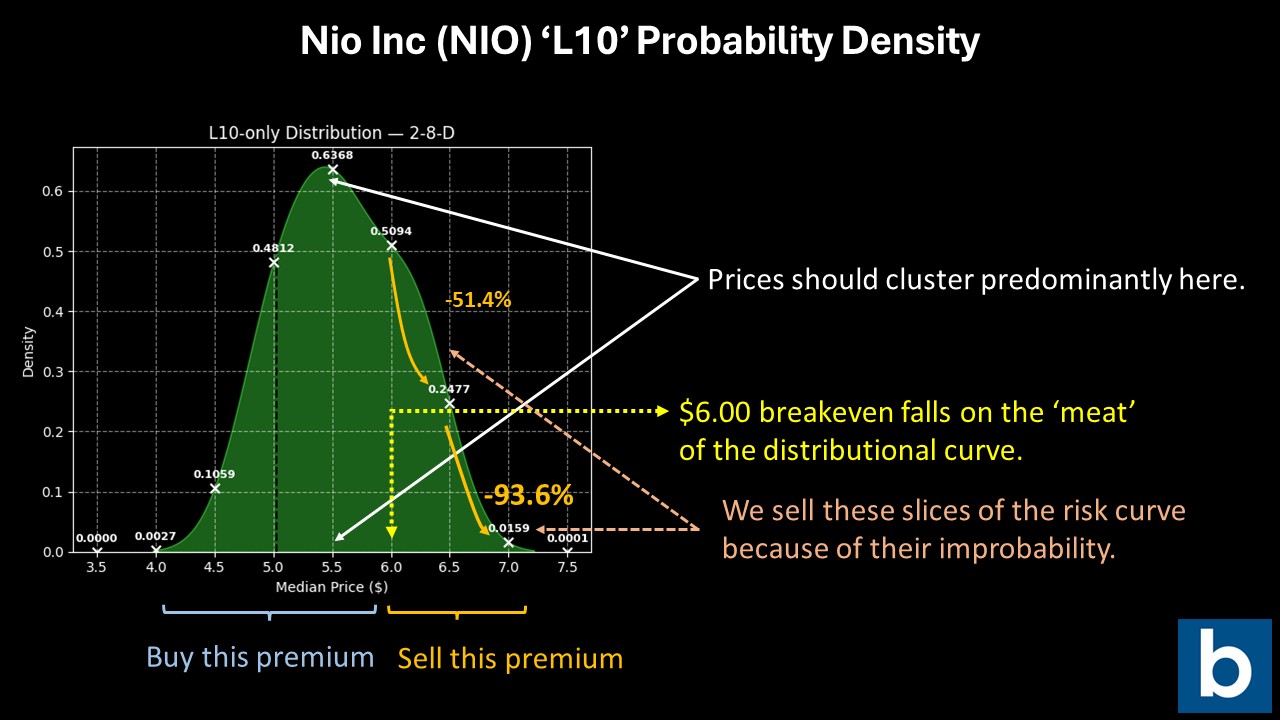
Based on the data, I’m looking at the 5.50/6.00 bull call spread expiring Feb. 20, 2026. This trade will need NIO stock to rise through the $6 strike at expiration to trigger the maximum payout, which stands at over 257%. With $6 near the densest portion of the probability curve, this call spread is attractive — and I would argue underpriced.
What’s more, because probability decay accelerates past $6, the 5.50/6.00 call spread also mitigates opportunity cost. While NIO stock could rise above $6, the chances of it doing so are less likely.
Keep close tabs on this trade because deals like this don’t come around too often.
On the date of publication, Josh Enomoto did not have (either directly or indirectly) positions in any of the securities mentioned in this article. All information and data in this article is solely for informational purposes. For more information please view the Barchart Disclosure Policy here.
More news from Barchart


