
Dave & Buster’s stock price has taken a beating over the past six months, shedding 45.7% of its value and falling to $16.34 per share. This was partly driven by its softer quarterly results and might have investors contemplating their next move.
Is there a buying opportunity in Dave & Buster's, or does it present a risk to your portfolio? Dive into our full research report to see our analyst team’s opinion, it’s free for active Edge members.
Why Do We Think Dave & Buster's Will Underperform?
Even though the stock has become cheaper, we don't have much confidence in Dave & Buster's. Here are three reasons there are better opportunities than PLAY and a stock we'd rather own.
1. Shrinking Same-Store Sales Indicate Waning Demand
Investors interested in Leisure Facilities companies should track same-store sales in addition to reported revenue. This metric measures the change in sales at brick-and-mortar locations that have existed for at least a year, giving visibility into Dave & Buster’s underlying demand characteristics.
Over the last two years, Dave & Buster’s same-store sales averaged 6.4% year-on-year declines. This performance was underwhelming and implies there may be increasing competition or market saturation. It also suggests Dave & Buster's might have to close some locations or change its strategy and pricing, which can disrupt operations. 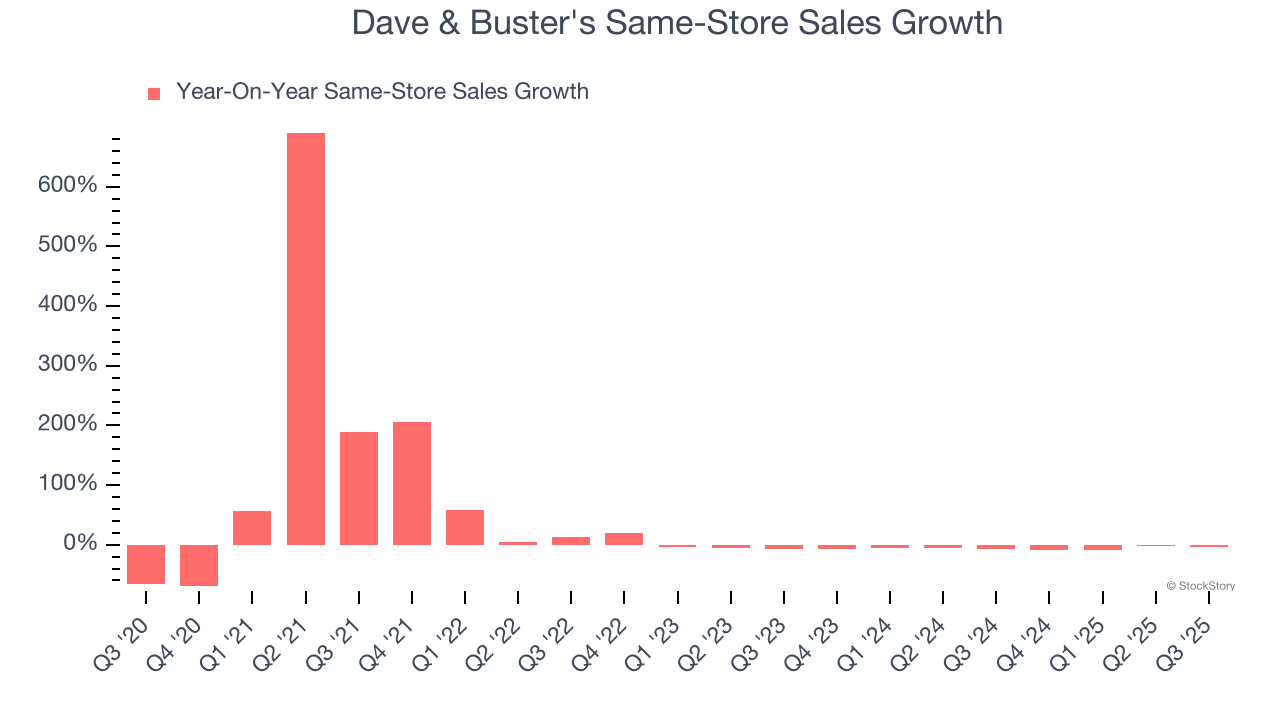
2. New Investments Fail to Bear Fruit as ROIC Declines
ROIC, or return on invested capital, is a metric showing how much operating profit a company generates relative to the money it has raised (debt and equity).
We like to invest in businesses with high returns, but the trend in a company’s ROIC is what often surprises the market and moves the stock price. Over the last few years, Dave & Buster’s ROIC averaged 3.9 percentage point decreases each year. Paired with its already low returns, these declines suggest its profitable growth opportunities are few and far between.
3. Short Cash Runway Exposes Shareholders to Potential Dilution
As long-term investors, the risk we care about most is the permanent loss of capital, which can happen when a company goes bankrupt or raises money from a disadvantaged position. This is separate from short-term stock price volatility, something we are much less bothered by.
Dave & Buster's burned through $195.6 million of cash over the last year, and its $3.11 billion of debt exceeds the $13.6 million of cash on its balance sheet. This is a deal breaker for us because indebted loss-making companies spell trouble.
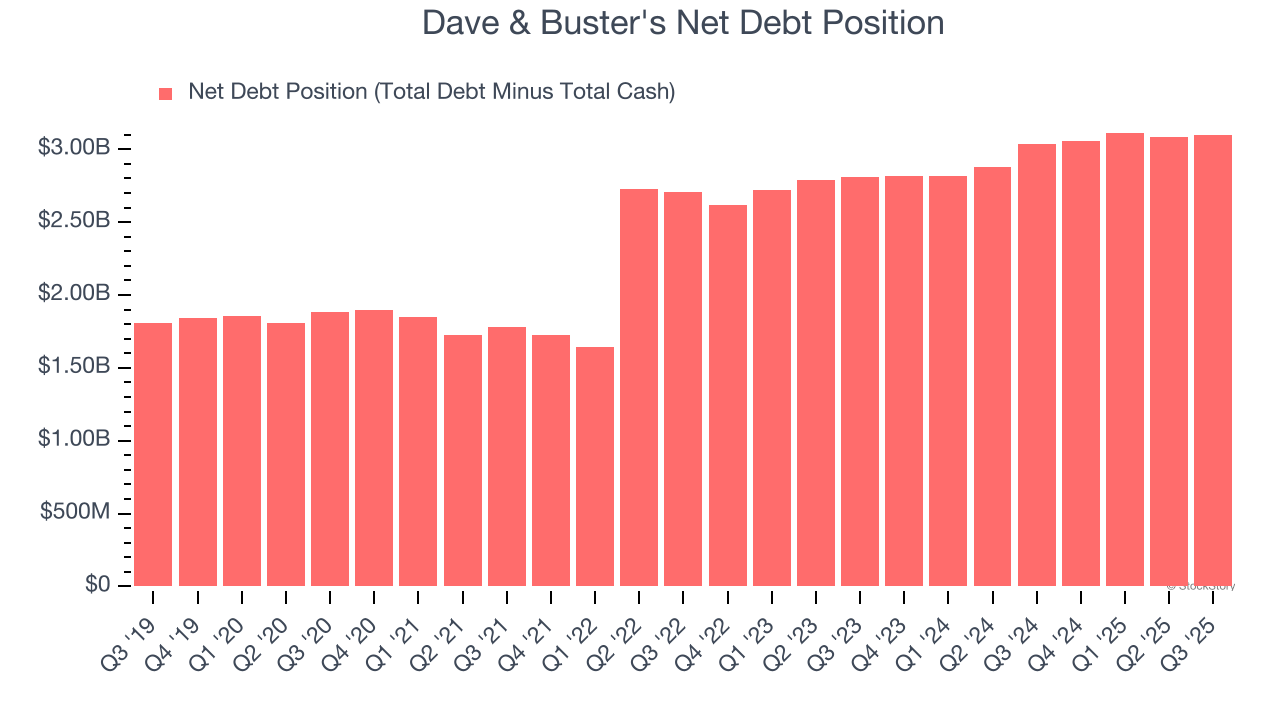
Unless the Dave & Buster’s fundamentals change quickly, it might find itself in a position where it must raise capital from investors to continue operating. Whether that would be favorable is unclear because dilution is a headwind for shareholder returns.
We remain cautious of Dave & Buster's until it generates consistent free cash flow or any of its announced financing plans materialize on its balance sheet.
Final Judgment
Dave & Buster's doesn’t pass our quality test. Following the recent decline, the stock trades at 20.4× forward P/E (or $16.34 per share). This valuation multiple is fair, but we don’t have much confidence in the company. There are better investments elsewhere. Let us point you toward one of our all-time favorite software stocks.
Stocks We Like More Than Dave & Buster's
The market’s up big this year - but there’s a catch. Just 4 stocks account for half the S&P 500’s entire gain. That kind of concentration makes investors nervous, and for good reason. While everyone piles into the same crowded names, smart investors are hunting quality where no one’s looking - and paying a fraction of the price. Check out the high-quality names we’ve flagged in our Top 5 Strong Momentum Stocks for this week. This is a curated list of our High Quality stocks that have generated a market-beating return of 244% over the last five years (as of June 30, 2025).
Stocks that have made our list include now familiar names such as Nvidia (+1,326% between June 2020 and June 2025) as well as under-the-radar businesses like the once-micro-cap company Tecnoglass (+1,754% five-year return). Find your next big winner with StockStory today.


