
Infrastructure and agriculture equipment manufacturer Valmont Industries (NYSE: VMI) announced better-than-expected revenue in Q4 CY2024, with sales up 2.1% year on year to $1.04 billion. On the other hand, the company’s full-year revenue guidance of $4.1 billion at the midpoint came in 1.3% below analysts’ estimates. Its GAAP profit of $3.84 per share was 5.9% above analysts’ consensus estimates.
Is now the time to buy Valmont? Find out by accessing our full research report, it’s free.
Valmont (VMI) Q4 CY2024 Highlights:
- Revenue: $1.04 billion vs analyst estimates of $1.01 billion (2.1% year-on-year growth, 2.6% beat)
- EPS (GAAP): $3.84 vs analyst estimates of $3.63 (5.9% beat)
- Adjusted EBITDA: $150.3 million vs analyst estimates of $139.5 million (14.5% margin, 7.7% beat)
- Management’s revenue guidance for the upcoming financial year 2025 is $4.1 billion at the midpoint, missing analyst estimates by 1.3% and implying 0.6% growth (vs -2.3% in FY2024)
- EPS (GAAP) guidance for the upcoming financial year 2025 is $18 at the midpoint, in line with analyst estimates
- Operating Margin: 11.6%, up from 6.3% in the same quarter last year
- Free Cash Flow Margin: 16.2%, up from 8.8% in the same quarter last year
- Backlog: $1.44 billion at quarter end
- Market Capitalization: $6.47 billion
President and Chief Executive Officer Avner M. Applbaum commented, “The fourth quarter capped off an outstanding year for Valmont as we continued executing our strategy. Both our Infrastructure and Agriculture segments achieved sales growth, and we expanded consolidated operating profit margins year-over-year through strategic pricing, improved operational efficiencies, and disciplined cost management. I want to thank the entire Valmont team for their dedication and hard work in delivering these strong results.”
Company Overview
Credited with an invention in the 1950s that improved crop yields, Valmont (NYSE: VMI) provides engineered products and infrastructure services for the agricultural industry.
Building Materials
Traditionally, building materials companies have built competitive advantages with economies of scale, brand recognition, and strong relationships with builders and contractors. More recently, advances to address labor availability and job site productivity have spurred innovation. Additionally, companies in the space that can produce more energy-efficient materials have opportunities to take share. However, these companies are at the whim of construction volumes, which tend to be cyclical and can be impacted heavily by economic factors such as interest rates. Additionally, the costs of raw materials can be driven by a myriad of worldwide factors and greatly influence the profitability of building materials companies.
Sales Growth
Examining a company’s long-term performance can provide clues about its quality. Any business can put up a good quarter or two, but the best consistently grow over the long haul. Luckily, Valmont’s sales grew at a decent 8.1% compounded annual growth rate over the last five years. Its growth was slightly above the average industrials company and shows its offerings resonate with customers.
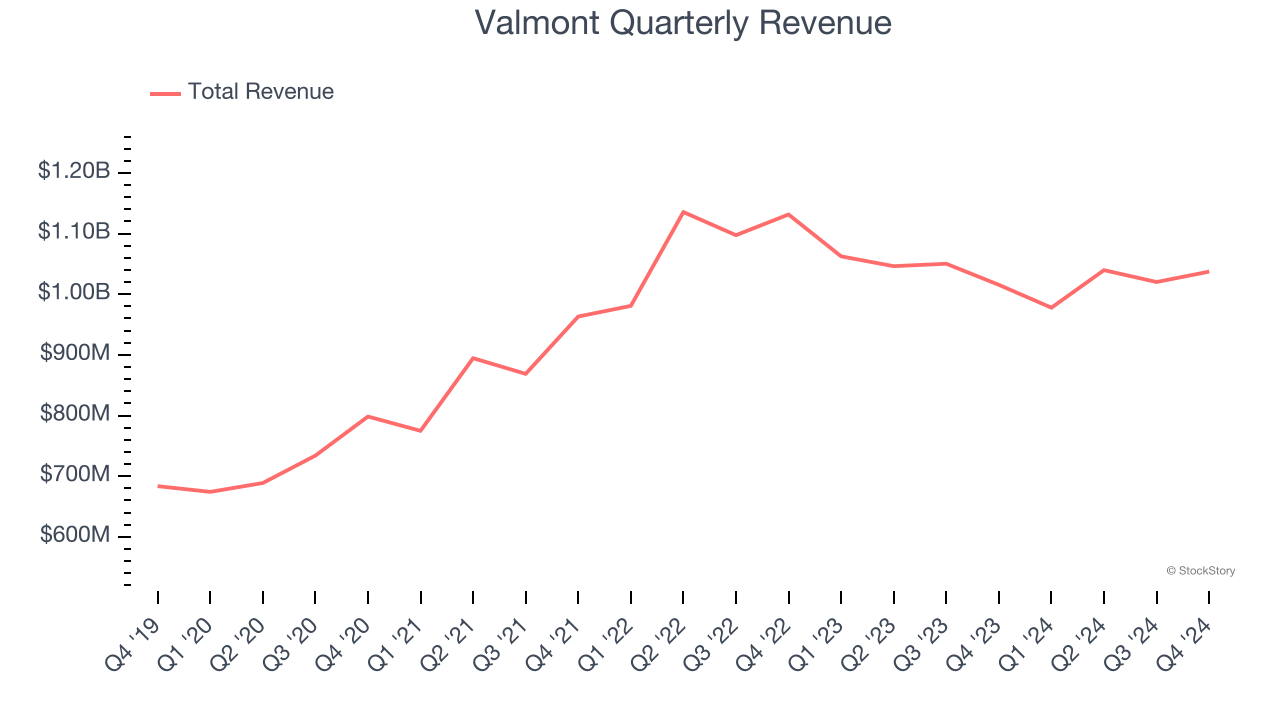
Long-term growth is the most important, but within industrials, a half-decade historical view may miss new industry trends or demand cycles. Valmont’s recent history marks a sharp pivot from its five-year trend as its revenue has shown annualized declines of 3.2% over the last two years. Valmont isn’t alone in its struggles as the Building Materials industry experienced a cyclical downturn, with many similar businesses observing lower sales at this time. 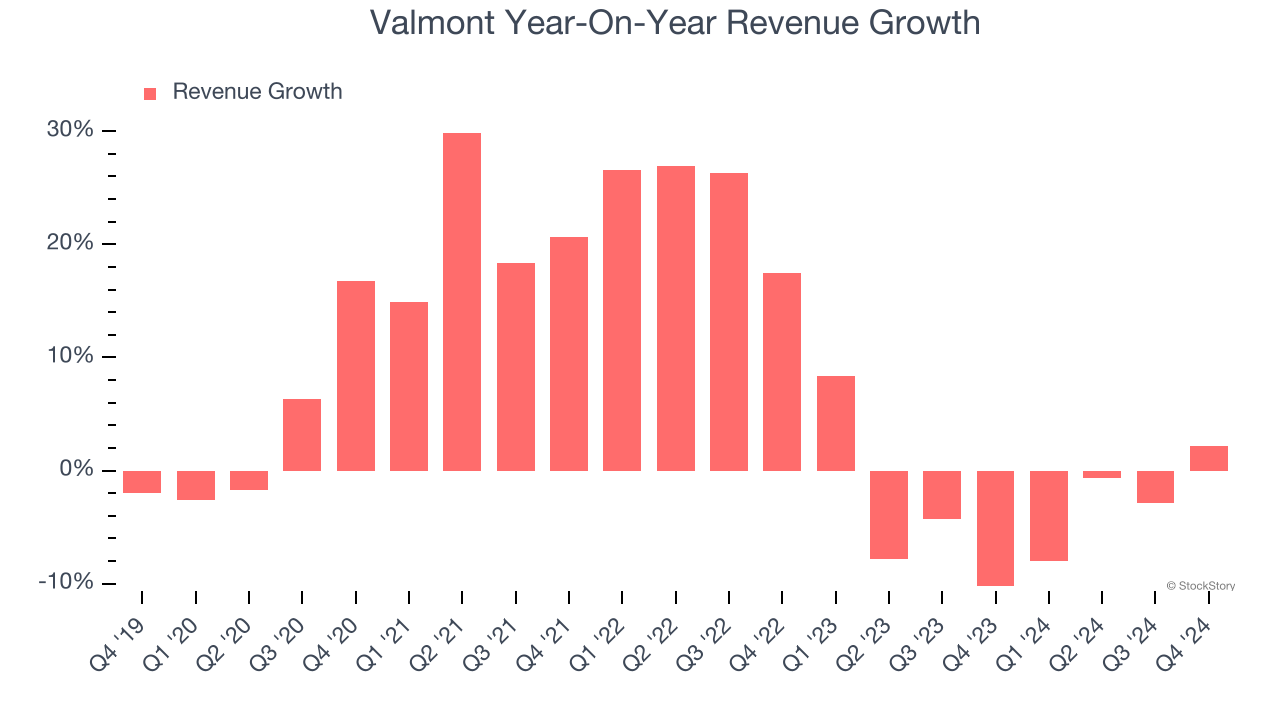
This quarter, Valmont reported modest year-on-year revenue growth of 2.1% but beat Wall Street’s estimates by 2.6%.
Looking ahead, sell-side analysts expect revenue to grow 2.2% over the next 12 months. While this projection suggests its newer products and services will fuel better top-line performance, it is still below the sector average.
Today’s young investors won’t have read the timeless lessons in Gorilla Game: Picking Winners In High Technology because it was written more than 20 years ago when Microsoft and Apple were first establishing their supremacy. But if we apply the same principles, then enterprise software stocks leveraging their own generative AI capabilities may well be the Gorillas of the future. So, in that spirit, we are excited to present our Special Free Report on a profitable, fast-growing enterprise software stock that is already riding the automation wave and looking to catch the generative AI next.
Operating Margin
Valmont has done a decent job managing its cost base over the last five years. The company has produced an average operating margin of 9.3%, higher than the broader industrials sector.
Looking at the trend in its profitability, Valmont’s operating margin rose by 5.1 percentage points over the last five years, as its sales growth gave it immense operating leverage.
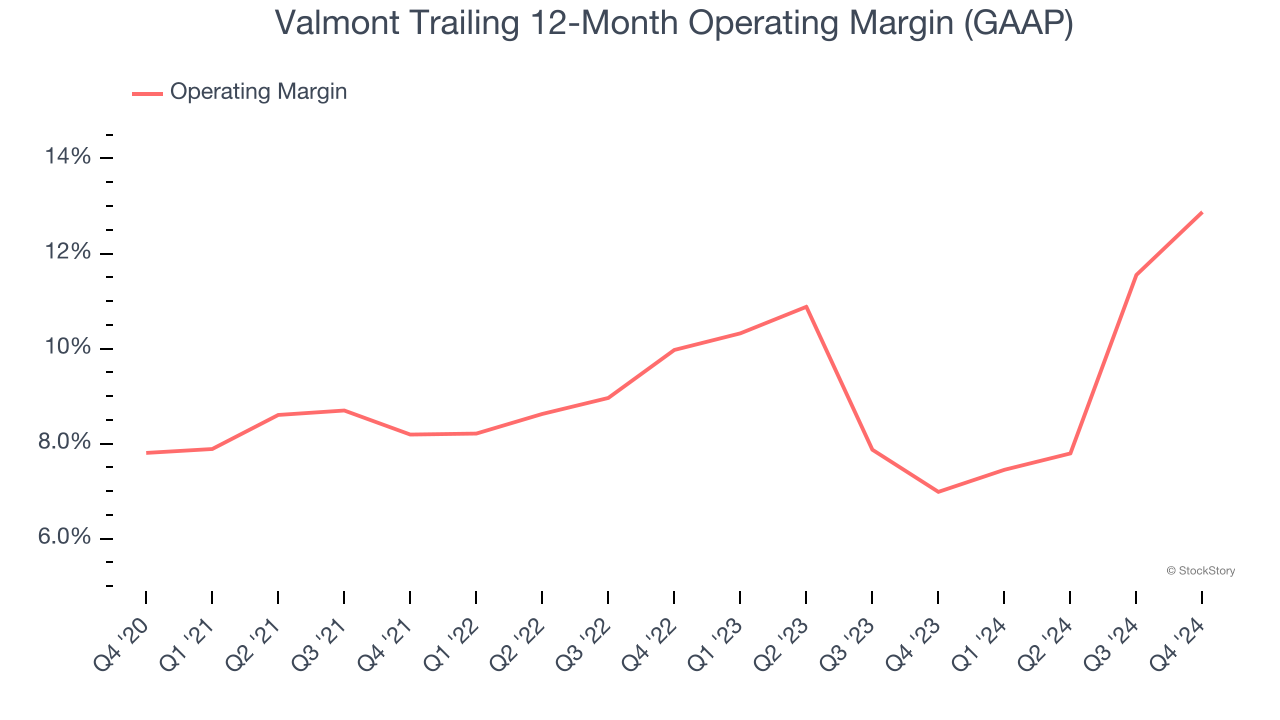
In Q4, Valmont generated an operating profit margin of 11.6%, up 5.3 percentage points year on year. The increase was solid, and since its operating margin rose more than its gross margin, we can infer it was recently more efficient with expenses such as marketing, R&D, and administrative overhead.
Earnings Per Share
We track the long-term change in earnings per share (EPS) for the same reason as long-term revenue growth. Compared to revenue, however, EPS highlights whether a company’s growth is profitable.
Valmont’s EPS grew at an astounding 20.6% compounded annual growth rate over the last five years, higher than its 8.1% annualized revenue growth. This tells us the company became more profitable on a per-share basis as it expanded.
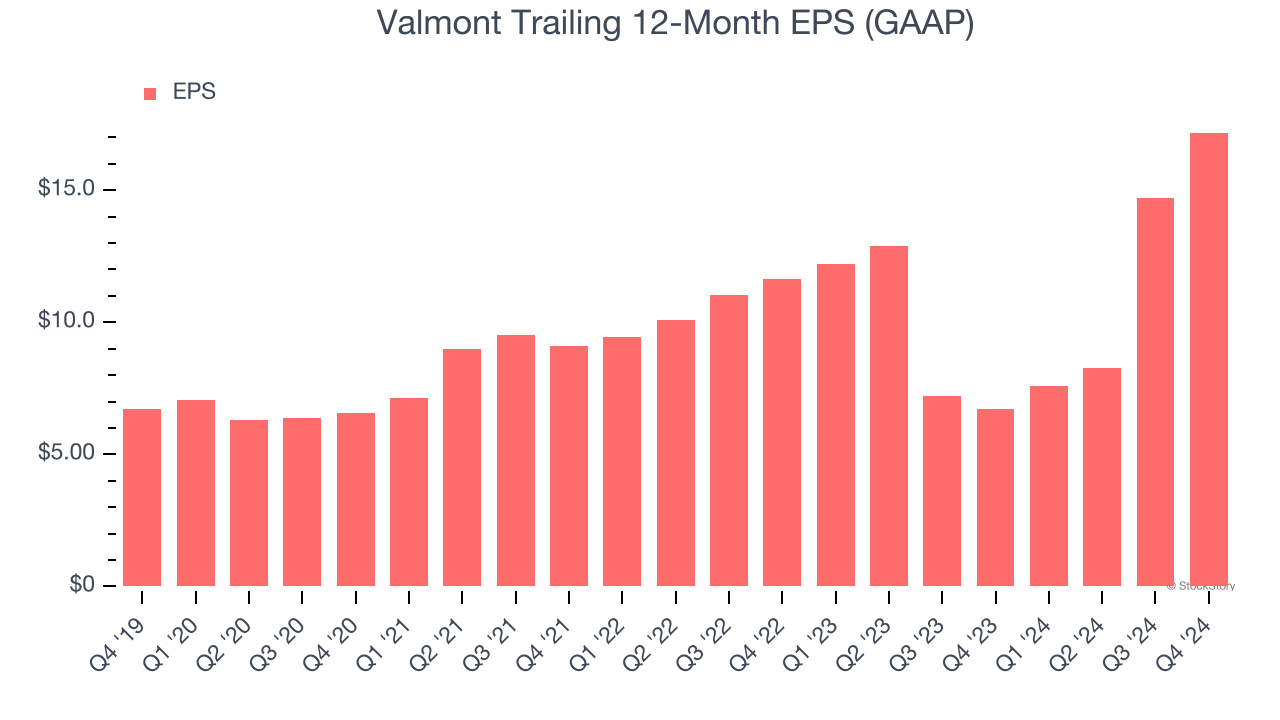
Diving into the nuances of Valmont’s earnings can give us a better understanding of its performance. As we mentioned earlier, Valmont’s operating margin expanded by 5.1 percentage points over the last five years. On top of that, its share count shrank by 6.5%. These are positive signs for shareholders because improving profitability and share buybacks turbocharge EPS growth relative to revenue growth. 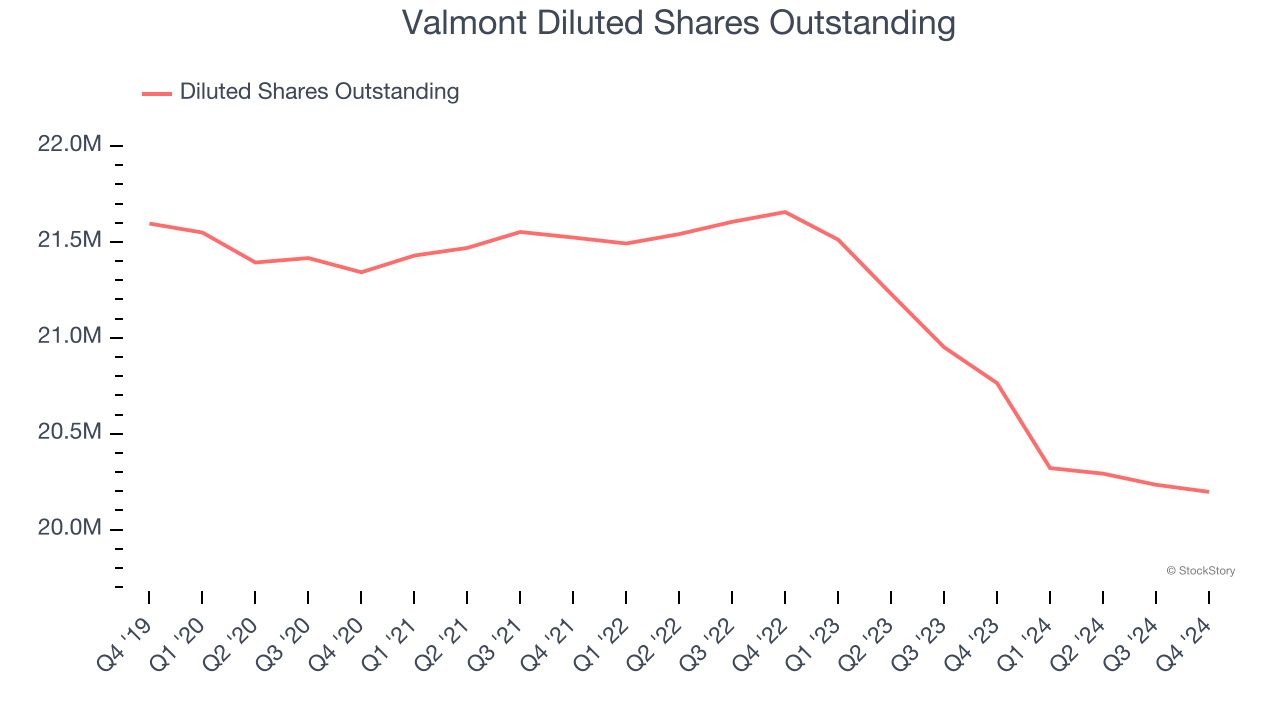
Like with revenue, we analyze EPS over a shorter period to see if we are missing a change in the business.
For Valmont, its two-year annual EPS growth of 21.5% is similar to its five-year trend, implying strong and stable earnings power.
In Q4, Valmont reported EPS at $3.84, up from $1.38 in the same quarter last year. This print beat analysts’ estimates by 5.9%. Over the next 12 months, Wall Street expects Valmont’s full-year EPS of $17.18 to grow 7.1%.
Key Takeaways from Valmont’s Q4 Results
The quarter was quite good, with revenue, EBITDA, and EPS all beating analysts’ expectations. While full-year revenue guidance slightly missed, full-year EPS guidance was in line. Overall, results weren't perfect but were solid. The stock traded up 1.4% to $324.29 immediately after reporting.
Indeed, Valmont had a rock-solid quarterly earnings result, but is this stock a good investment here? What happened in the latest quarter matters, but not as much as longer-term business quality and valuation, when deciding whether to invest in this stock. We cover that in our actionable full research report which you can read here, it’s free.


