
Homebuilder Lennar (NYSE: LEN) beat Wall Street’s revenue expectations in Q2 CY2025, but sales fell by 4.4% year on year to $8.38 billion. Its GAAP profit of $1.81 per share was 6.7% below analysts’ consensus estimates.
Is now the time to buy Lennar? Find out by accessing our full research report, it’s free.
Lennar (LEN) Q2 CY2025 Highlights:
- Revenue: $8.38 billion vs analyst estimates of $8.29 billion (4.4% year-on-year decline, 1.1% beat)
- EPS (GAAP): $1.81 vs analyst expectations of $1.94 (6.7% miss)
- Calendar Q2 guidance: 22,500 deliveries at $383k average sale price (deliveries in line, average sale price slightly below $398k expectation)
- Operating Margin: 8.1%, down from 13.9% in the same quarter last year
- Backlog: $6.5 billion at quarter end, down 21.1% year on year
- Market Capitalization: $28.5 billion
Stuart Miller, Executive Chairman and Co-Chief Executive Officer of Lennar, said, "While we continue to see softness in the housing market due to affordability challenges and a decline in consumer confidence, we adhered to our strategy of driving starts, sales, and closings in order to build long-term efficiencies in our business."
Company Overview
One of the largest homebuilders in America, Lennar (NYSE: LEN) is known for constructing affordable, move-up, and retirement homes across a range of markets and communities.
Revenue Growth
Examining a company’s long-term performance can provide clues about its quality. Any business can put up a good quarter or two, but many enduring ones grow for years. Luckily, Lennar’s sales grew at a solid 9.4% compounded annual growth rate over the last five years. Its growth beat the average industrials company and shows its offerings resonate with customers.
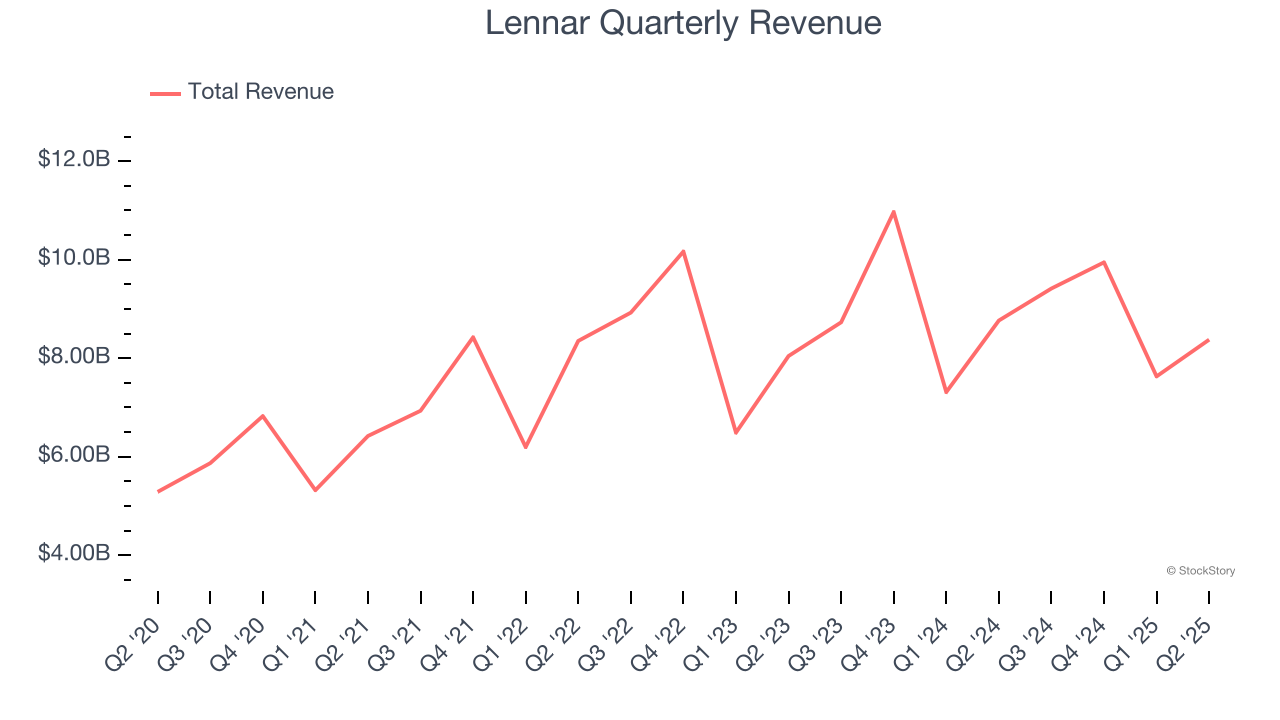
Long-term growth is the most important, but within industrials, a half-decade historical view may miss new industry trends or demand cycles. Lennar’s recent performance shows its demand has slowed as its annualized revenue growth of 2.6% over the last two years was below its five-year trend. 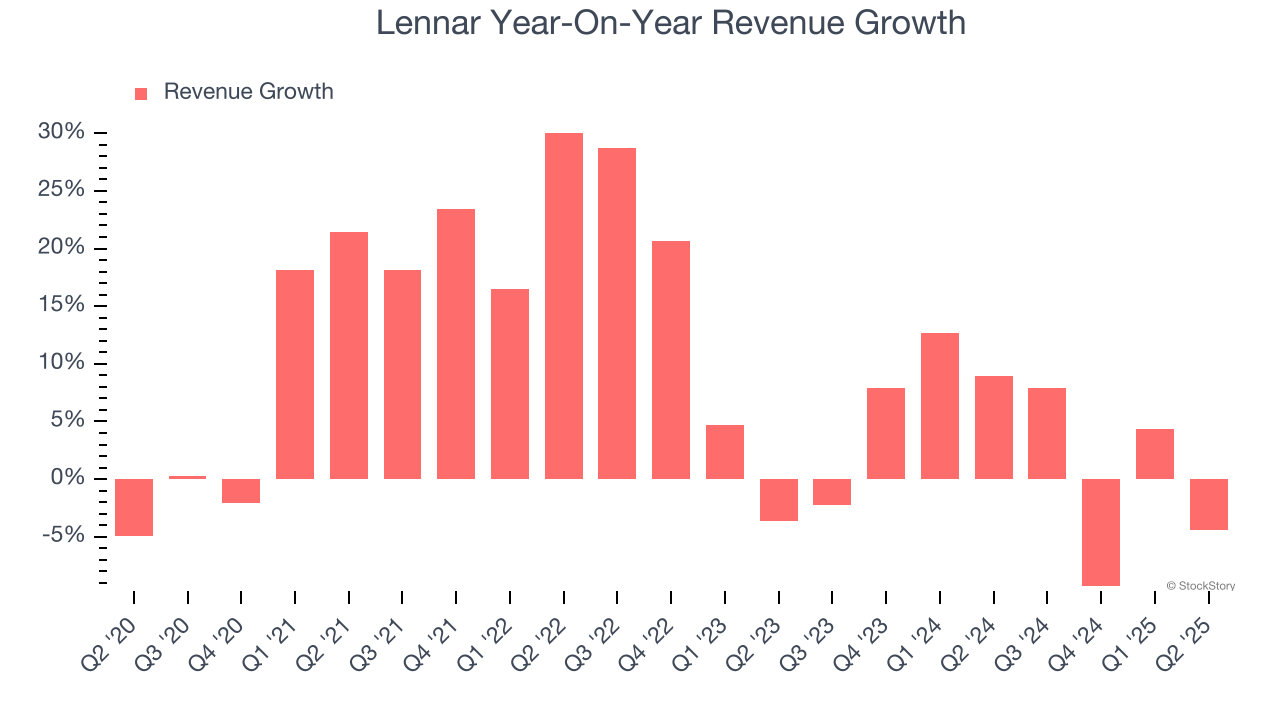
We can dig further into the company’s revenue dynamics by analyzing its backlog, or the value of its outstanding orders that have not yet been executed or delivered. Lennar’s backlog reached $6.5 billion in the latest quarter and averaged 20.4% year-on-year declines over the last two years. Because this number is lower than its revenue growth, we can see the company hasn’t secured enough new orders to maintain its growth rate in the future. 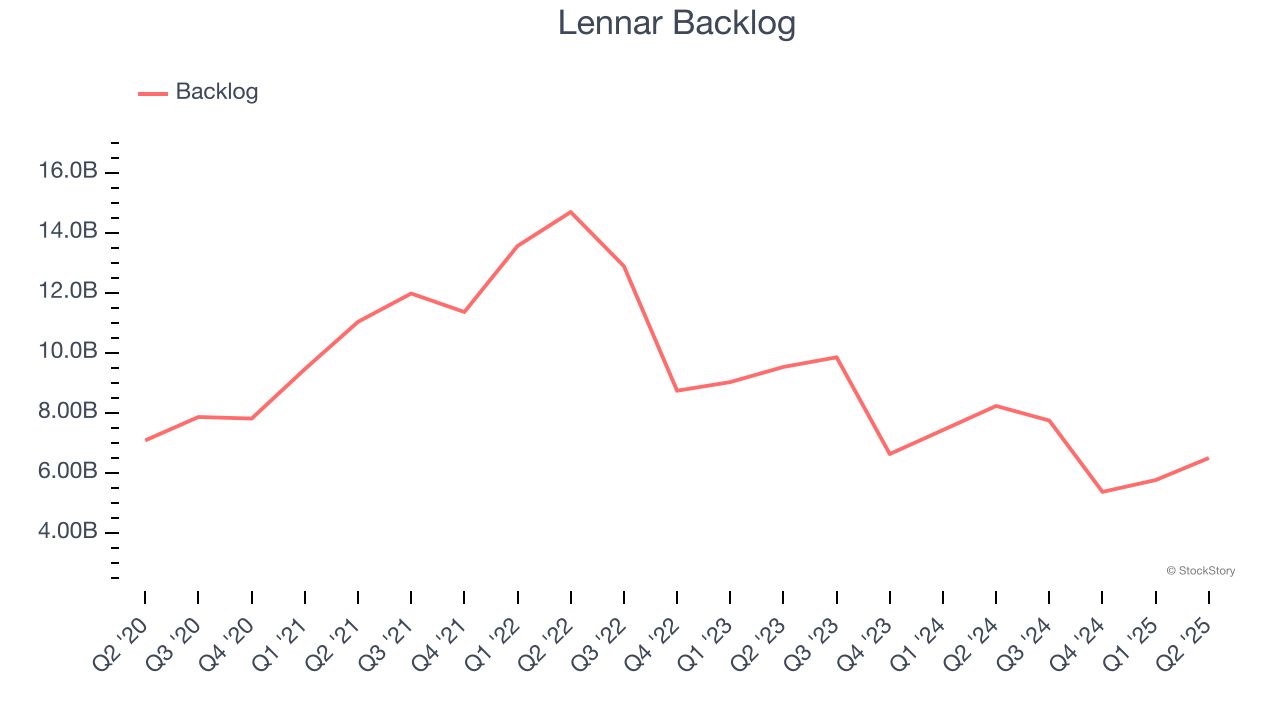
This quarter, Lennar’s revenue fell by 4.4% year on year to $8.38 billion but beat Wall Street’s estimates by 1.1%.
Looking ahead, sell-side analysts expect revenue to grow 3% over the next 12 months, similar to its two-year rate. This projection is underwhelming and indicates its newer products and services will not catalyze better top-line performance yet.
Here at StockStory, we certainly understand the potential of thematic investing. Diverse winners from Microsoft (MSFT) to Alphabet (GOOG), Coca-Cola (KO) to Monster Beverage (MNST) could all have been identified as promising growth stories with a megatrend driving the growth. So, in that spirit, we’ve identified a relatively under-the-radar profitable growth stock benefiting from the rise of AI, available to you FREE via this link.
Operating Margin
Operating margin is one of the best measures of profitability because it tells us how much money a company takes home after procuring and manufacturing its products, marketing and selling those products, and most importantly, keeping them relevant through research and development.
Lennar has been a well-oiled machine over the last five years. It demonstrated elite profitability for an industrials business, boasting an average operating margin of 15.9%. This result was particularly impressive because of its low gross margin, which is mostly a factor of what it sells and takes huge shifts to move meaningfully. Companies have more control over their operating margins, and it’s a show of well-managed operations if they’re high when gross margins are low.
Analyzing the trend in its profitability, Lennar’s operating margin decreased by 5.1 percentage points over the last five years. This raises questions about the company’s expense base because its revenue growth should have given it leverage on its fixed costs, resulting in better economies of scale and profitability.
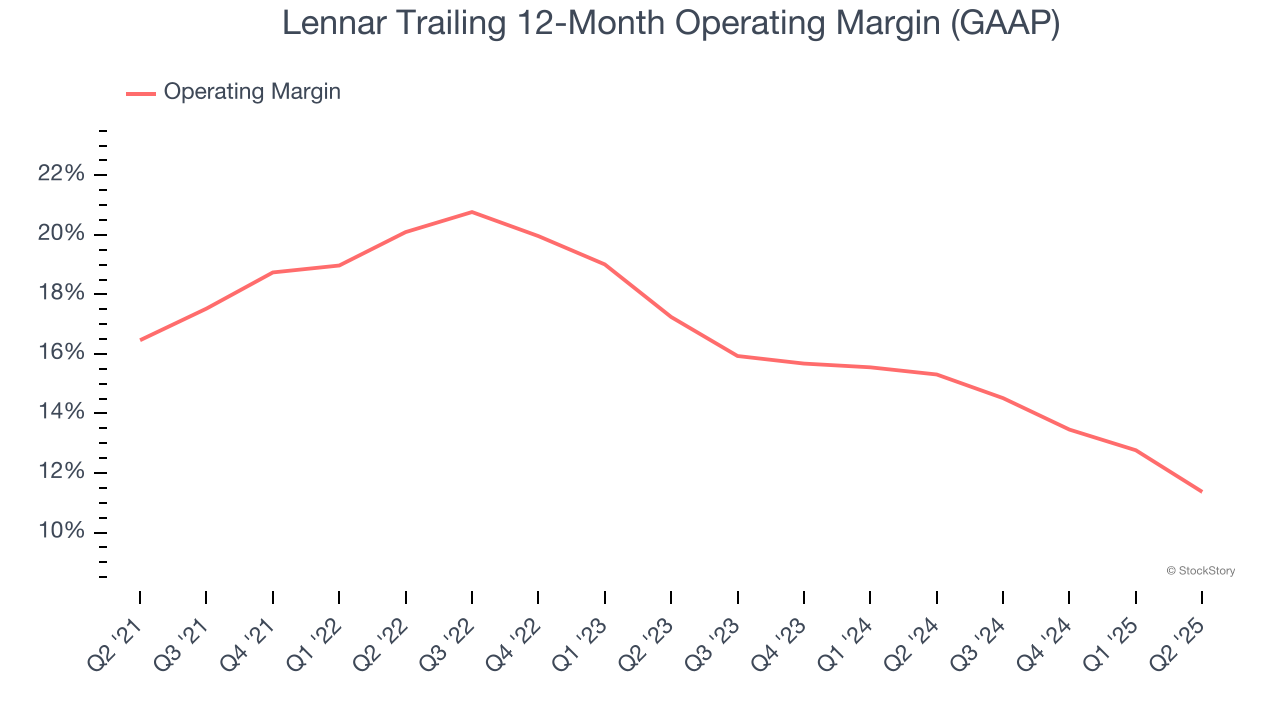
This quarter, Lennar generated an operating margin profit margin of 8.1%, down 5.8 percentage points year on year. Since Lennar’s operating margin decreased more than its gross margin, we can assume it was less efficient because expenses such as marketing, R&D, and administrative overhead increased.
Earnings Per Share
Revenue trends explain a company’s historical growth, but the long-term change in earnings per share (EPS) points to the profitability of that growth – for example, a company could inflate its sales through excessive spending on advertising and promotions.
Lennar’s EPS grew at a remarkable 12.7% compounded annual growth rate over the last five years, higher than its 9.4% annualized revenue growth. However, this alone doesn’t tell us much about its business quality because its operating margin didn’t improve.
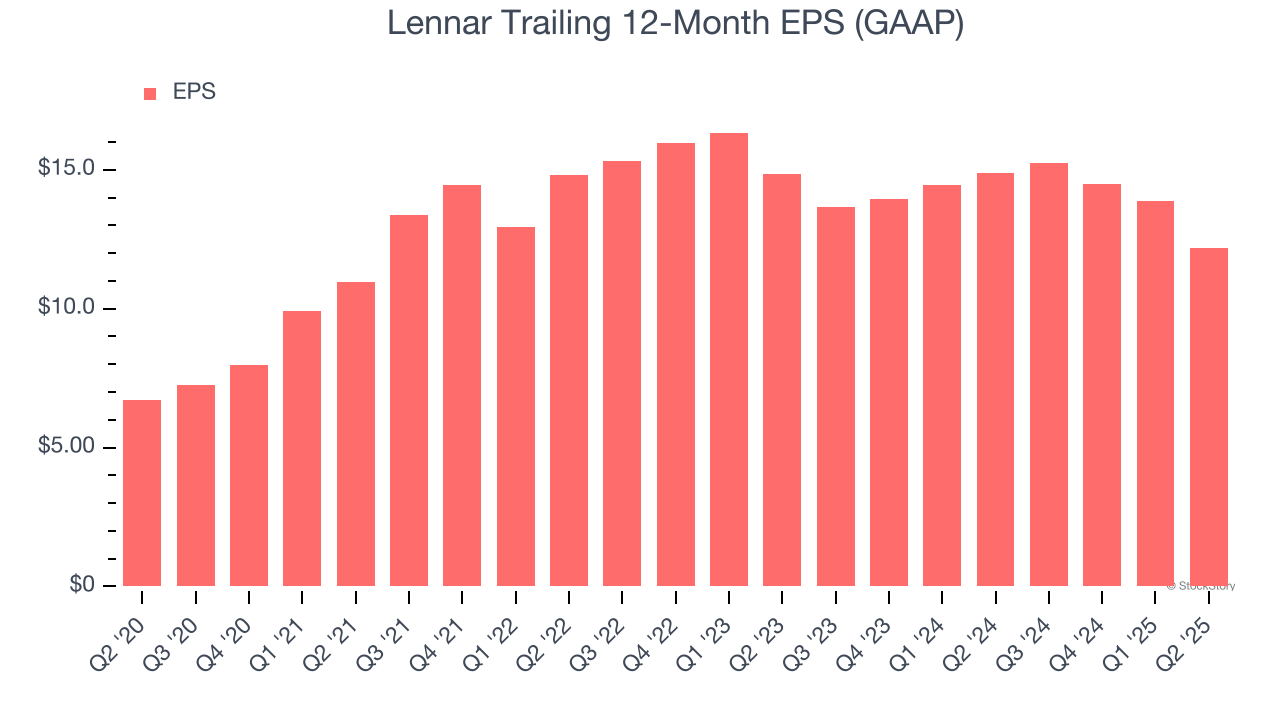
Diving into the nuances of Lennar’s earnings can give us a better understanding of its performance. A five-year view shows that Lennar has repurchased its stock, shrinking its share count by 15.6%. This tells us its EPS outperformed its revenue not because of increased operational efficiency but financial engineering, as buybacks boost per share earnings. 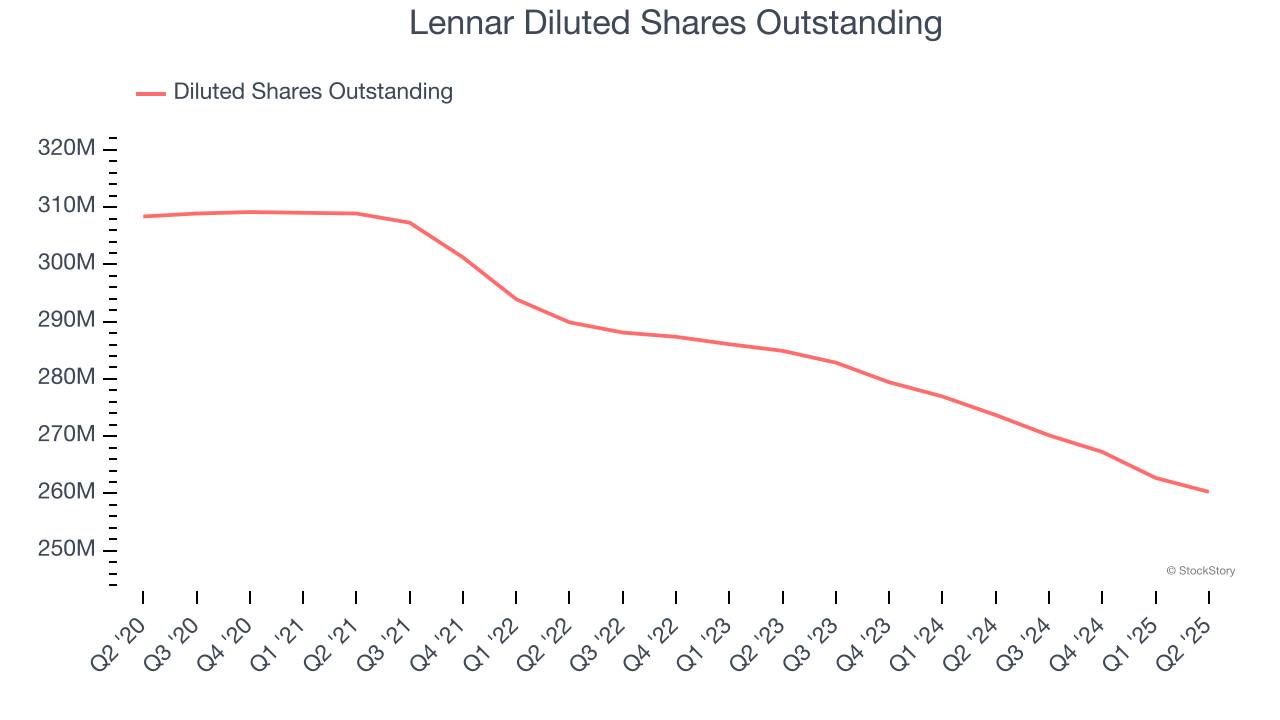
Like with revenue, we analyze EPS over a more recent period because it can provide insight into an emerging theme or development for the business.
For Lennar, its two-year annual EPS declines of 9.4% mark a reversal from its (seemingly) healthy five-year trend. We hope Lennar can return to earnings growth in the future.
In Q2, Lennar reported EPS at $1.81, down from $3.49 in the same quarter last year. This print missed analysts’ estimates, but we care more about long-term EPS growth than short-term movements. Over the next 12 months, Wall Street expects Lennar’s full-year EPS of $12.19 to shrink by 14.8%.
Key Takeaways from Lennar’s Q2 Results
It was good to see Lennar narrowly top analysts’ revenue expectations this quarter. On the other hand, its backlog and EPS both missed. Looking ahead, guidance for next quarter was also mixed, with deliveries coming in in-line with Wall Street's expectations while average sales price was below. Overall, this quarter had both positives and negatives. The stock traded up 3.6% to $113.35 immediately following the results.
So do we think Lennar is an attractive buy at the current price? When making that decision, it’s important to consider its valuation, business qualities, as well as what has happened in the latest quarter. We cover that in our actionable full research report which you can read here, it’s free.


