
Consumer financial services company Synchrony Financial (NYSE: SYF) fell short of the markets revenue expectations in Q4 CY2025, with sales flat year on year at $3.79 billion. Its GAAP profit of $2.04 per share was in line with analysts’ consensus estimates.
Is now the time to buy Synchrony Financial? Find out by accessing our full research report, it’s free.
Synchrony Financial (SYF) Q4 CY2025 Highlights:
- Net Interest Margin: 15.8% vs analyst estimates of 15.6% (18.2 basis point beat)
- Revenue: $3.79 billion vs analyst estimates of $3.85 billion (flat year on year, 1.5% miss)
- Efficiency Ratio: 36.9% vs analyst estimates of 32.8% (411.2 basis point miss)
- EPS (GAAP): $2.04 vs analyst estimates of $2.05 (in line)
- Tangible Book Value per Share: $37.21 vs analyst estimates of $39.01 (9.2% year-on-year growth, 4.6% miss)
- Market Capitalization: $27.92 billion
Company Overview
Powering over 73 million active accounts and partnerships with major brands like Amazon, PayPal, and Lowe's, Synchrony Financial (NYSE: SYF) provides credit cards, installment loans, and banking products through partnerships with retailers, healthcare providers, and digital platforms.
Revenue Growth
A company’s long-term sales performance is one signal of its overall quality. Any business can put up a good quarter or two, but many enduring ones grow for years. Unfortunately, Synchrony Financial’s 6.1% annualized revenue growth over the last five years was mediocre. This wasn’t a great result compared to the rest of the financials sector, but there are still things to like about Synchrony Financial.
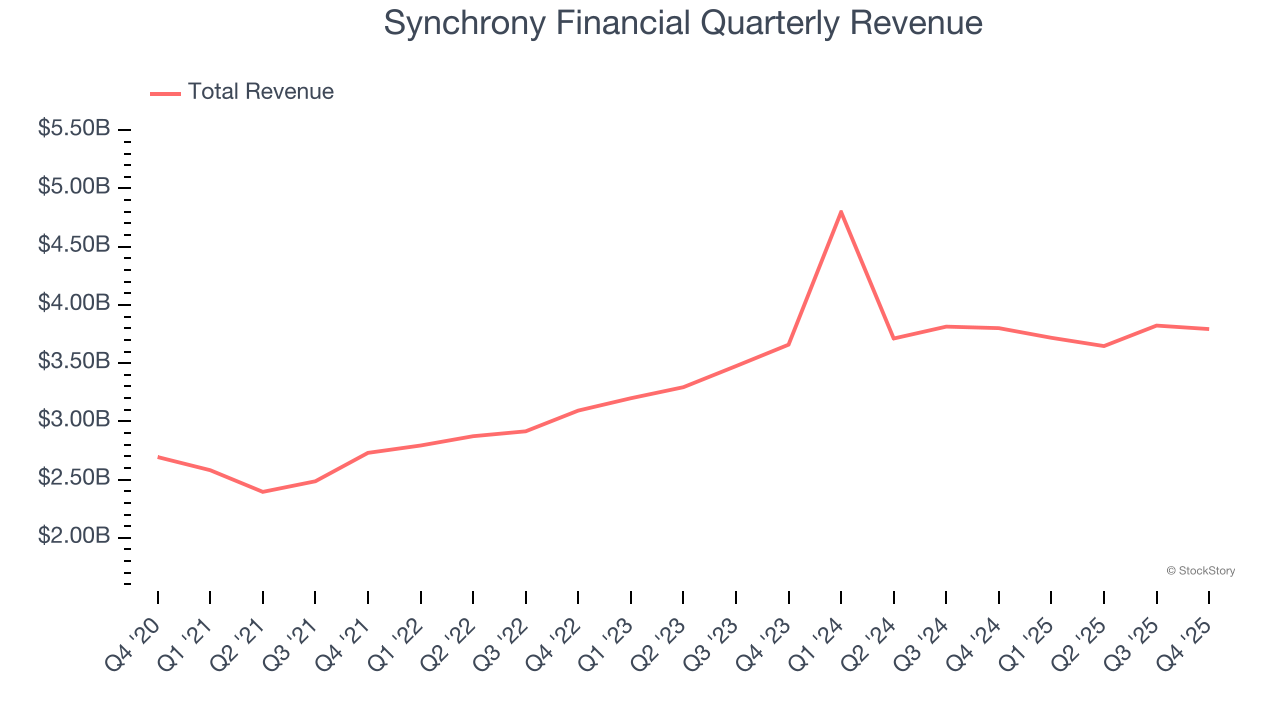
We at StockStory place the most emphasis on long-term growth, but within financials, a half-decade historical view may miss recent interest rate changes, market returns, and industry trends. Synchrony Financial’s recent performance shows its demand has slowed as its annualized revenue growth of 4.9% over the last two years was below its five-year trend. 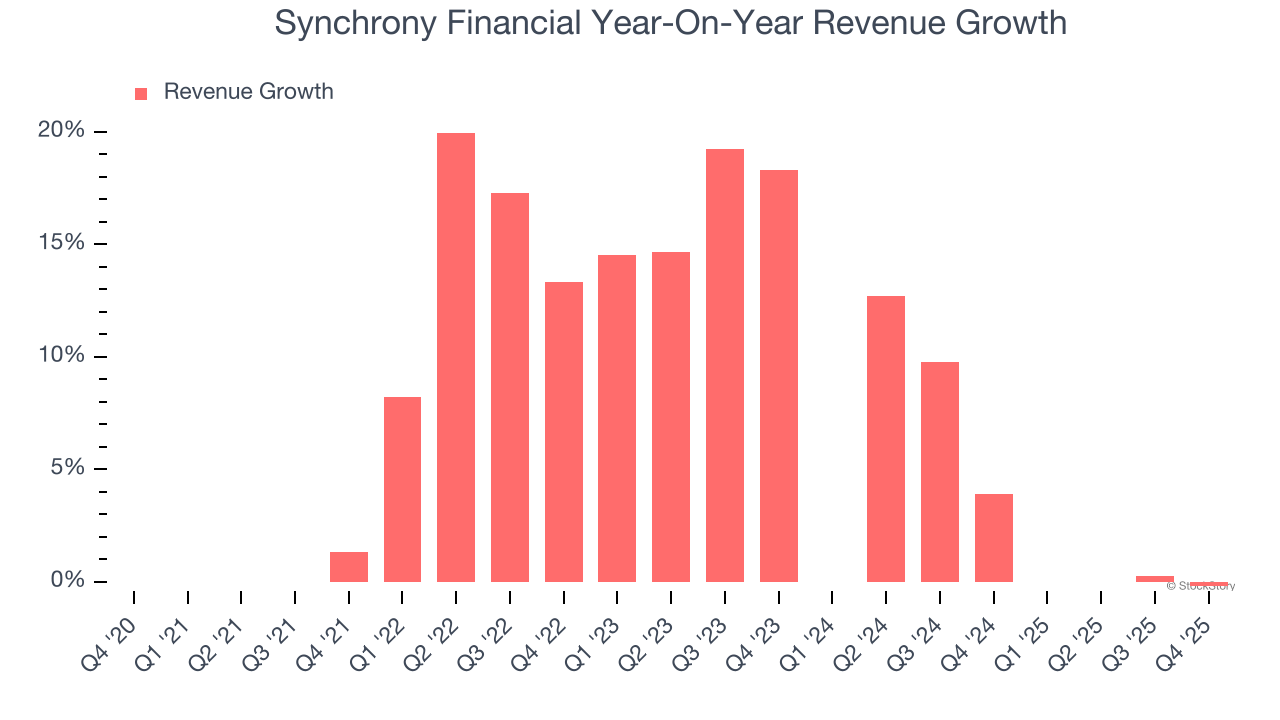 Note: Quarters not shown were determined to be outliers, impacted by outsized investment gains/losses that are not indicative of the recurring fundamentals of the business.
This quarter, Synchrony Financial missed Wall Street’s estimates and reported a rather uninspiring 0.2% year-on-year revenue decline, generating $3.79 billion of revenue.
Software is eating the world and there is virtually no industry left that has been untouched by it. That drives increasing demand for tools helping software developers do their jobs, whether it be monitoring critical cloud infrastructure, integrating audio and video functionality, or ensuring smooth content streaming. Click here to access a free report on our 3 favorite stocks to play this generational megatrend.
Tangible Book Value Per Share (TBVPS)
Financial firms profit by providing a wide range of services, making them fundamentally balance sheet-driven enterprises with multiple intermediation roles. Market participants emphasize balance sheet quality and sustained book value growth when evaluating these multifaceted institutions.
Because of this, tangible book value per share (TBVPS) emerges as the critical performance benchmark for the sector. This metric captures real, liquid net worth per share that reflects the institution’s overall financial health across all business lines. On the other hand, EPS is often distorted by the diverse nature of operations, mergers, and various accounting treatments across different business units. Book value provides clearer performance insights.
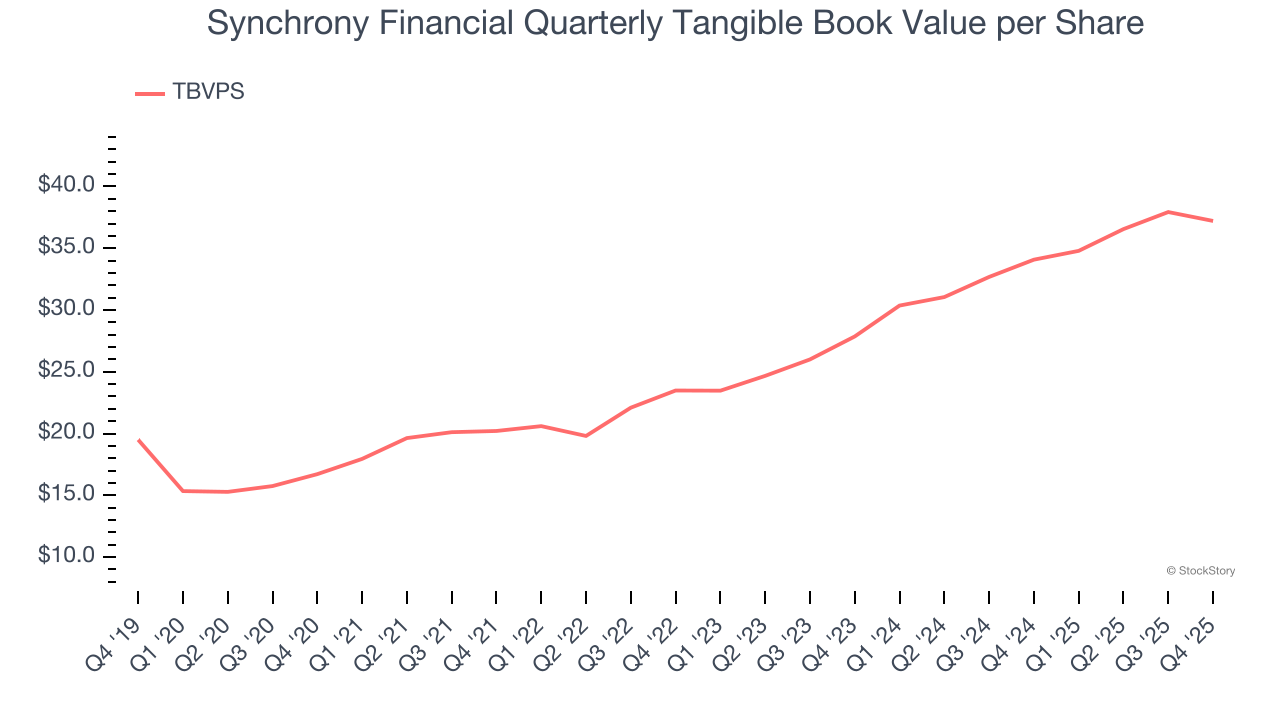
Synchrony Financial’s TBVPS grew at an excellent 17.4% annual clip over the last five years. TBVPS growth has recently decelerated a bit to 15.6% annual growth over the last two years (from $27.86 to $37.21 per share).

Tangible Book Value Per Share (TBVPS)
Financial firms are valued based on their balance sheet strength and ability to compound book value across diverse business lines.
When analyzing this sector, tangible book value per share (TBVPS) takes precedence over many other metrics. This measure isolates genuine per-share value and provides insight into the institution’s capital position across diverse operations. Other (and more commonly known) per-share metrics like EPS can sometimes be murky due to the complexity of multiple business lines, M&A activity, or accounting rules that vary across different financial services segments.
Synchrony Financial’s TBVPS grew at an excellent 17.4% annual clip over the last five years. TBVPS growth has recently decelerated a bit to 15.6% annual growth over the last two years (from $27.86 to $37.21 per share).
Key Takeaways from Synchrony Financial’s Q4 Results
We were impressed by how significantly Synchrony Financial blew past analysts’ net interest margin expectations this quarter. On the other hand, its revenue slightly missed and efficiency ratio came in below expectations (lower is better). Overall, this was a weaker quarter. The stock traded down 2% to $75.99 immediately following the results.
Synchrony Financial didn’t show it’s best hand this quarter, but does that create an opportunity to buy the stock right now? When making that decision, it’s important to consider its valuation, business qualities, as well as what has happened in the latest quarter. We cover that in our actionable full research report which you can read here (it’s free).