
Food processing and aviation equipment manufacturer John Bean (NYSE: JBT) reported revenue ahead of Wall Street’s expectations in Q4 CY2025, with sales up 116% year on year to $1.01 billion. The company’s full-year revenue guidance of $4.03 billion at the midpoint came in 2.3% above analysts’ estimates. Its non-GAAP profit of $1.98 per share was 2.7% above analysts’ consensus estimates.
Is now the time to buy John Bean? Find out by accessing our full research report, it’s free.
John Bean (JBTM) Q4 CY2025 Highlights:
- Revenue: $1.01 billion vs analyst estimates of $996.9 million (116% year-on-year growth, 1.1% beat)
- Adjusted EPS: $1.98 vs analyst estimates of $1.93 (2.7% beat)
- Adjusted EBITDA: $161.1 million vs analyst estimates of $167.1 million (16% margin, 3.6% miss)
- Adjusted EPS guidance for the upcoming financial year 2026 is $8.25 at the midpoint, beating analyst estimates by 6.8%
- EBITDA guidance for the upcoming financial year 2026 is $692.5 million at the midpoint, above analyst estimates of $674.1 million
- Operating Margin: 7.2%, up from 3.4% in the same quarter last year
- Free Cash Flow Margin: 8.3%, down from 25.7% in the same quarter last year
- Market Capitalization: $8.57 billion
“We delivered on our ambitious expectations for our first year operating as JBT Marel and demonstrated that we are truly better together," said Brian Deck, Chief Executive Officer.
Company Overview
Tracing back to its invention of the mechanical milk bottle filler in 1884, John Bean (NYSE: JBT) designs, manufactures, and sells equipment used for food processing and aviation.
Revenue Growth
Reviewing a company’s long-term sales performance reveals insights into its quality. Any business can experience short-term success, but top-performing ones enjoy sustained growth for years. Luckily, John Bean’s sales grew at an incredible 17.1% compounded annual growth rate over the last five years. Its growth beat the average industrials company and shows its offerings resonate with customers, a helpful starting point for our analysis.
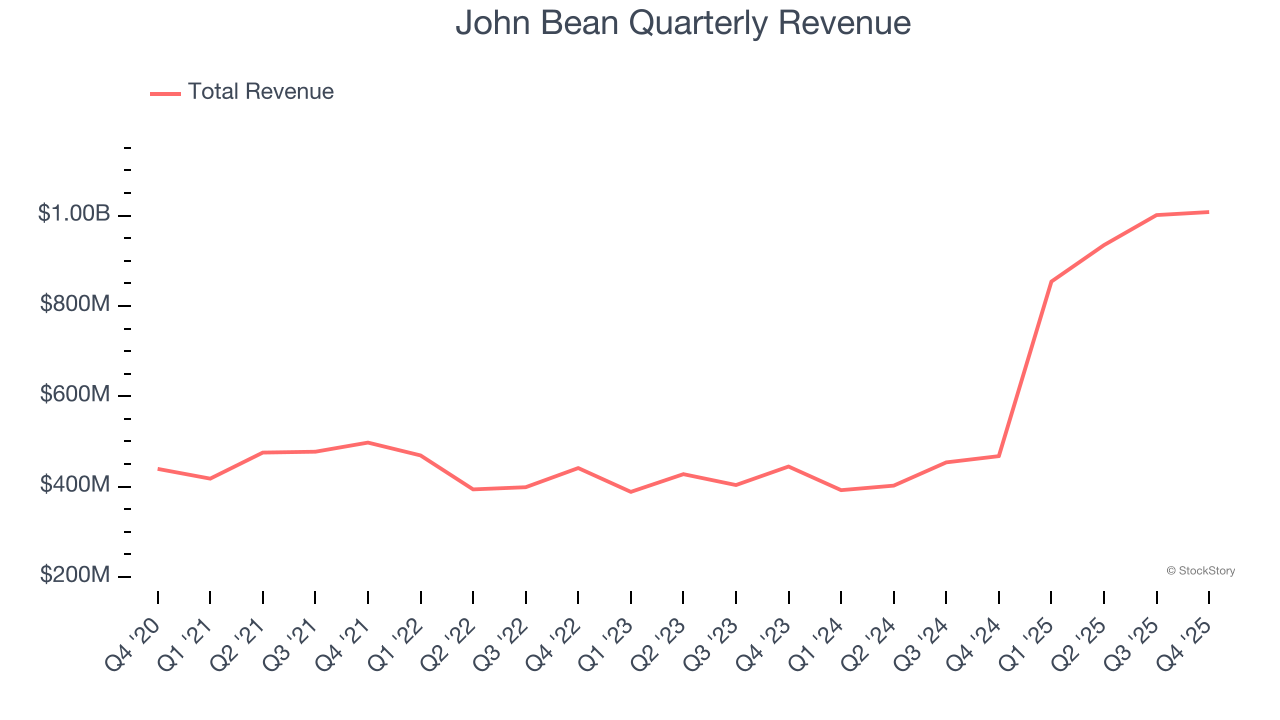
Long-term growth is the most important, but within industrials, a half-decade historical view may miss new industry trends or demand cycles. John Bean’s annualized revenue growth of 51.1% over the last two years is above its five-year trend, suggesting its demand was strong and recently accelerated. 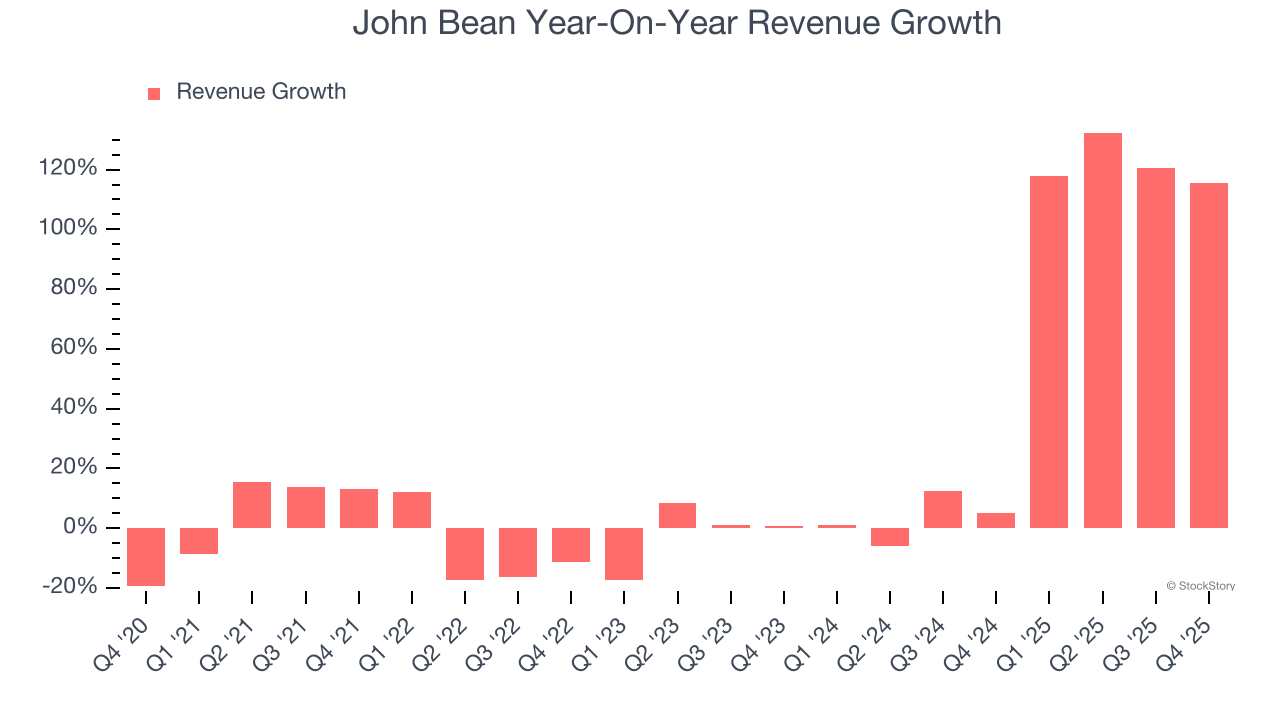
This quarter, John Bean reported magnificent year-on-year revenue growth of 116%, and its $1.01 billion of revenue beat Wall Street’s estimates by 1.1%.
Looking ahead, sell-side analysts expect revenue to grow 5% over the next 12 months, a deceleration versus the last two years. This projection doesn't excite us and suggests its products and services will see some demand headwinds. At least the company is tracking well in other measures of financial health.
Microsoft, Alphabet, Coca-Cola, Monster Beverage—all began as under-the-radar growth stories riding a massive trend. We’ve identified the next one: a profitable AI semiconductor play Wall Street is still overlooking. Go here for access to our full report.
Operating Margin
Operating margin is an important measure of profitability as it shows the portion of revenue left after accounting for all core expenses – everything from the cost of goods sold to advertising and wages. It’s also useful for comparing profitability across companies with different levels of debt and tax rates because it excludes interest and taxes.
John Bean was profitable over the last five years but held back by its large cost base. Its average operating margin of 7.2% was weak for an industrials business. This result is surprising given its high gross margin as a starting point.
Analyzing the trend in its profitability, John Bean’s operating margin decreased by 3.6 percentage points over the last five years. This raises questions about the company’s expense base because its revenue growth should have given it leverage on its fixed costs, resulting in better economies of scale and profitability. John Bean’s performance was poor no matter how you look at it - it shows that costs were rising and it couldn’t pass them onto its customers.
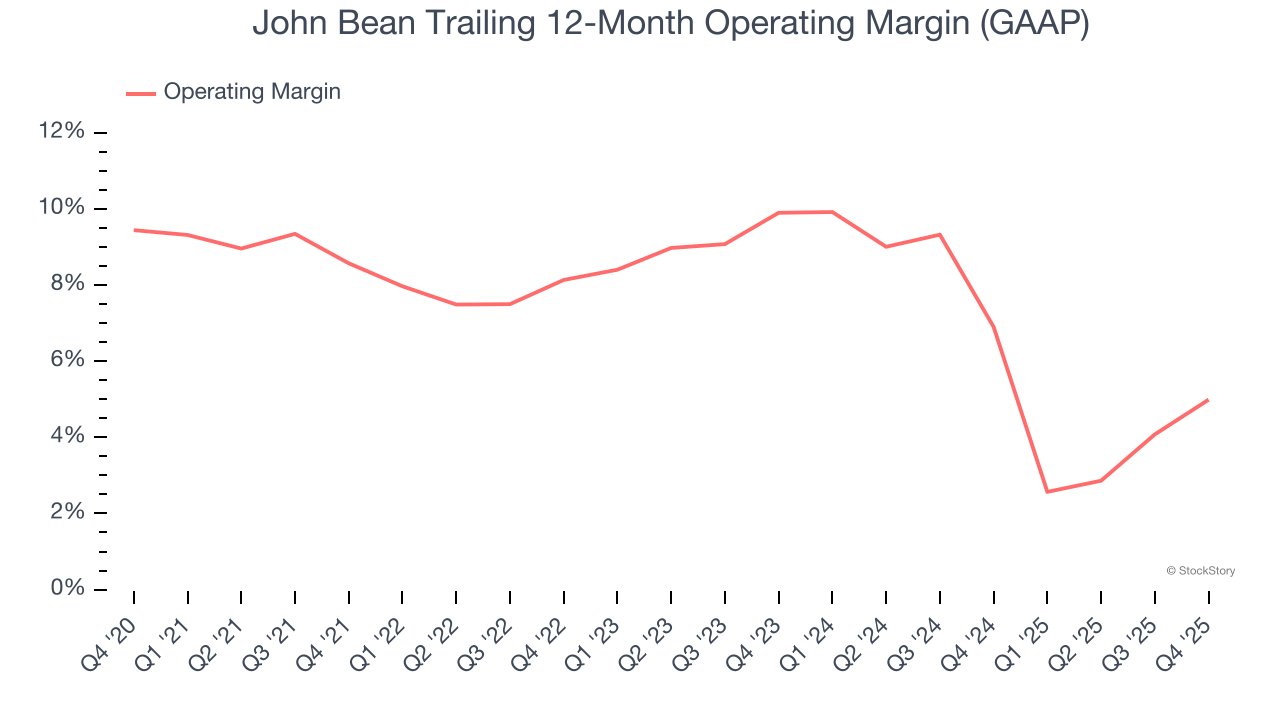
In Q4, John Bean generated an operating margin profit margin of 7.2%, up 3.8 percentage points year on year. The increase was encouraging, and because its gross margin actually decreased, we can assume it was more efficient because its operating expenses like marketing, R&D, and administrative overhead grew slower than its revenue.
Earnings Per Share
Revenue trends explain a company’s historical growth, but the long-term change in earnings per share (EPS) points to the profitability of that growth – for example, a company could inflate its sales through excessive spending on advertising and promotions.
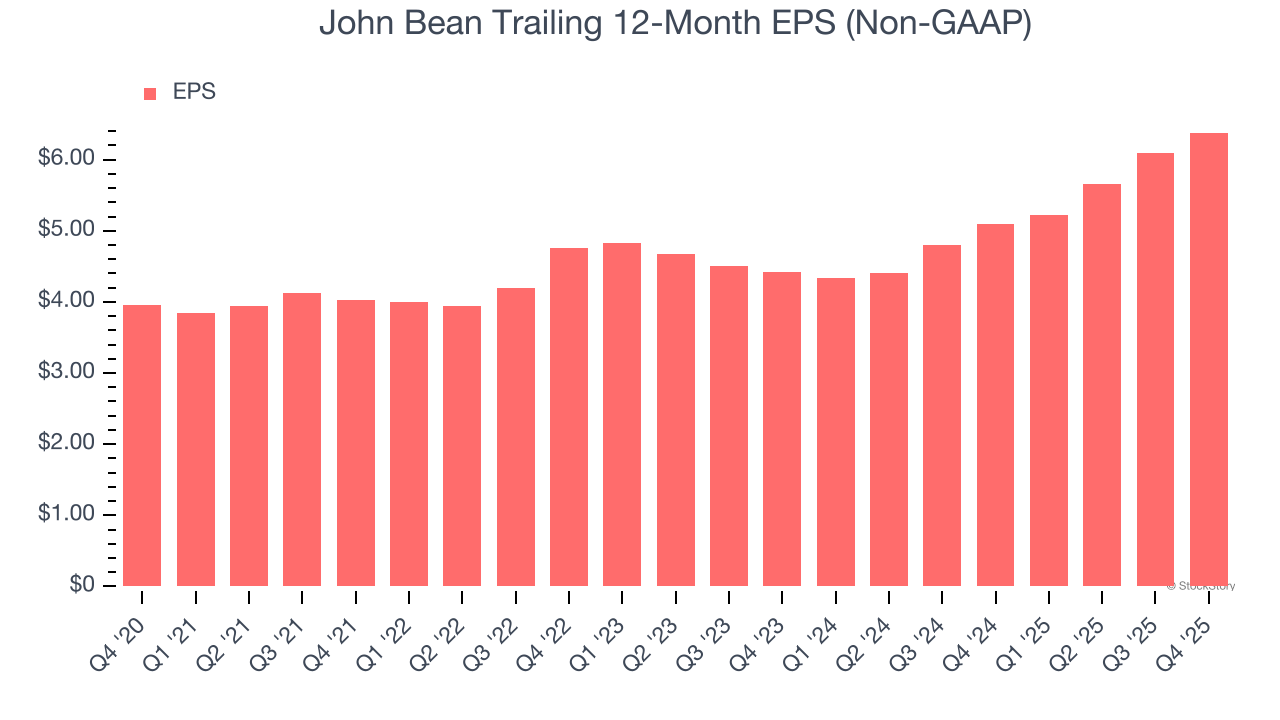
John Bean’s EPS grew at a solid 10.1% compounded annual growth rate over the last five years. However, this performance was lower than its 17.1% annualized revenue growth, telling us the company became less profitable on a per-share basis as it expanded.
Diving into the nuances of John Bean’s earnings can give us a better understanding of its performance. As we mentioned earlier, John Bean’s operating margin expanded this quarter but declined by 3.6 percentage points over the last five years. Its share count also grew by 62.9%, meaning the company not only became less efficient with its operating expenses but also diluted its shareholders. 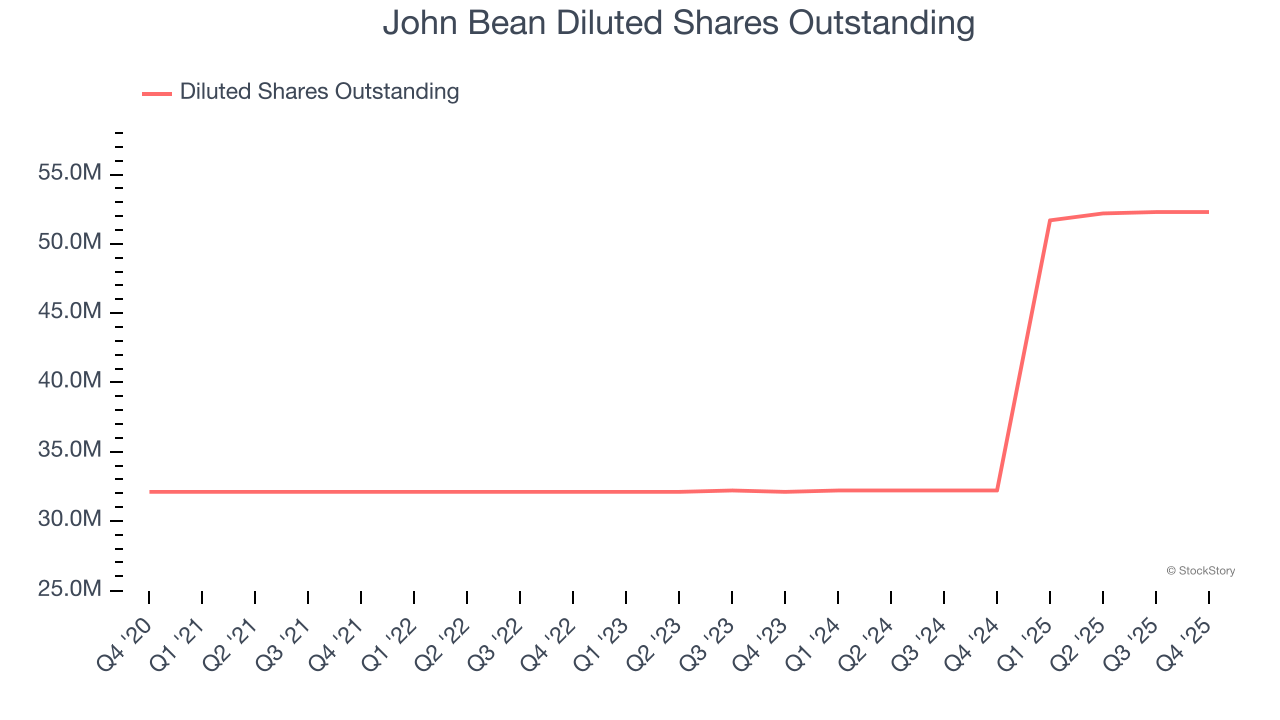
Like with revenue, we analyze EPS over a more recent period because it can provide insight into an emerging theme or development for the business.
For John Bean, its two-year annual EPS growth of 20.1% was higher than its five-year trend. We love it when earnings growth accelerates, especially when it accelerates off an already high base.
In Q4, John Bean reported adjusted EPS of $1.98, up from $1.70 in the same quarter last year. This print beat analysts’ estimates by 2.7%. Over the next 12 months, Wall Street expects John Bean’s full-year EPS of $6.38 to grow 23.5%.
Key Takeaways from John Bean’s Q4 Results
It was great to see John Bean’s full-year EBITDA guidance top analysts’ expectations. We were also glad its full-year revenue guidance exceeded Wall Street’s estimates. On the other hand, its EBITDA missed. Overall, we think this was a solid quarter with some key areas of upside. The stock remained flat at $163.51 immediately following the results.
Big picture, is John Bean a buy here and now? The latest quarter does matter, but not nearly as much as longer-term fundamentals and valuation, when deciding if the stock is a buy. We cover that in our actionable full research report which you can read here (it’s free).


