
Professional services firm Huron Consulting Group (NASDAQ: HURN) missed Wall Street’s revenue expectations in Q4 CY2025, but sales rose 10.7% year on year to $442 million. On the other hand, the company’s outlook for the full year was close to analysts’ estimates with revenue guided to $1.82 billion at the midpoint. Its non-GAAP profit of $2.17 per share was 11.3% above analysts’ consensus estimates.
Is now the time to buy Huron? Find out by accessing our full research report, it’s free.
Huron (HURN) Q4 CY2025 Highlights:
- Revenue: $442 million vs analyst estimates of $446 million (10.7% year-on-year growth, 0.9% miss)
- Adjusted EPS: $2.17 vs analyst estimates of $1.95 (11.3% beat)
- Adjusted EBITDA: $68.01 million vs analyst estimates of $67.27 million (15.4% margin, 1.1% beat)
- Adjusted EPS guidance for the upcoming financial year 2026 is $8.75 at the midpoint, in line with analyst estimates
- Operating Margin: 11.4%, in line with the same quarter last year
- Free Cash Flow Margin: 28%, down from 33.2% in the same quarter last year
- Market Capitalization: $2.03 billion
Company Overview
Founded in 2002 during a time of significant regulatory change in corporate America, Huron Consulting Group (NASDAQ: HURN) is a professional services company that helps organizations develop growth strategies, optimize operations, and implement digital transformation solutions.
Revenue Growth
Examining a company’s long-term performance can provide clues about its quality. Any business can put up a good quarter or two, but the best consistently grow over the long haul.
With $1.70 billion in revenue over the past 12 months, Huron is a mid-sized business services company, which sometimes brings disadvantages compared to larger competitors benefiting from better economies of scale. On the bright side, it can still flex high growth rates because it’s working from a smaller revenue base.
As you can see below, Huron grew its sales at an exceptional 14.3% compounded annual growth rate over the last five years. This is a great starting point for our analysis because it shows Huron’s demand was higher than many business services companies.
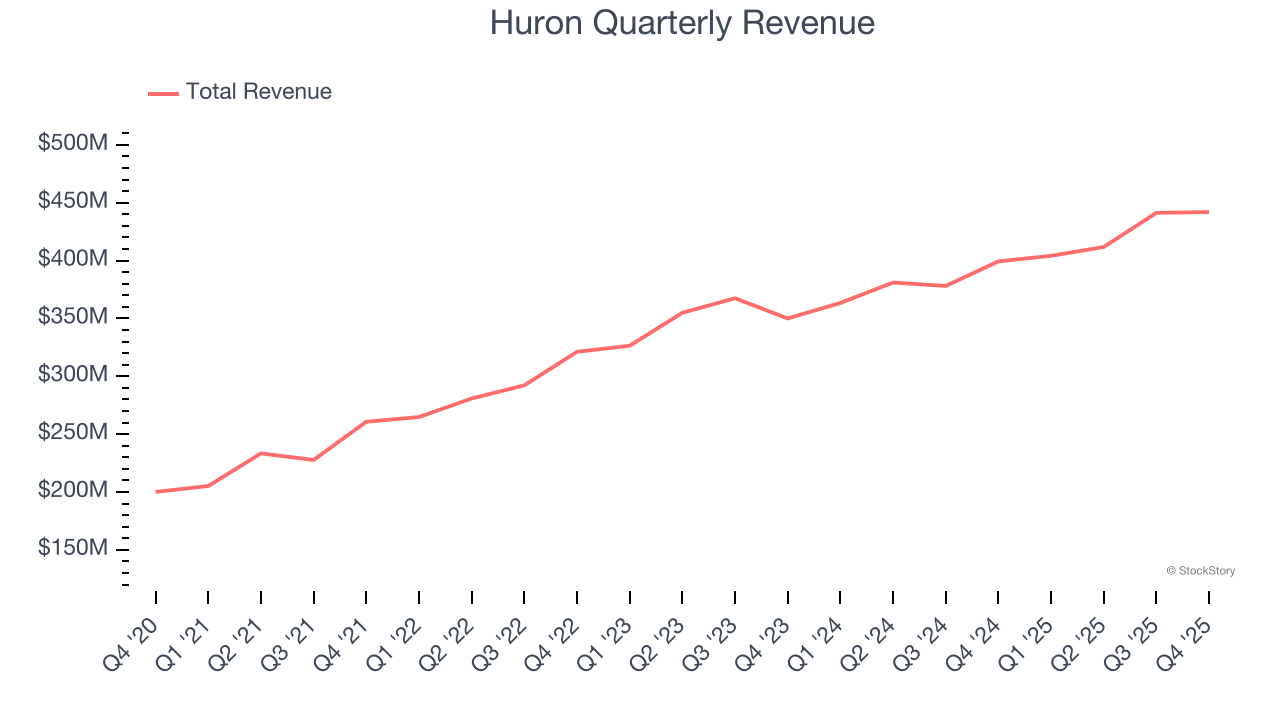
We at StockStory place the most emphasis on long-term growth, but within business services, a half-decade historical view may miss recent innovations or disruptive industry trends. Huron’s annualized revenue growth of 10.2% over the last two years is below its five-year trend, but we still think the results suggest healthy demand. 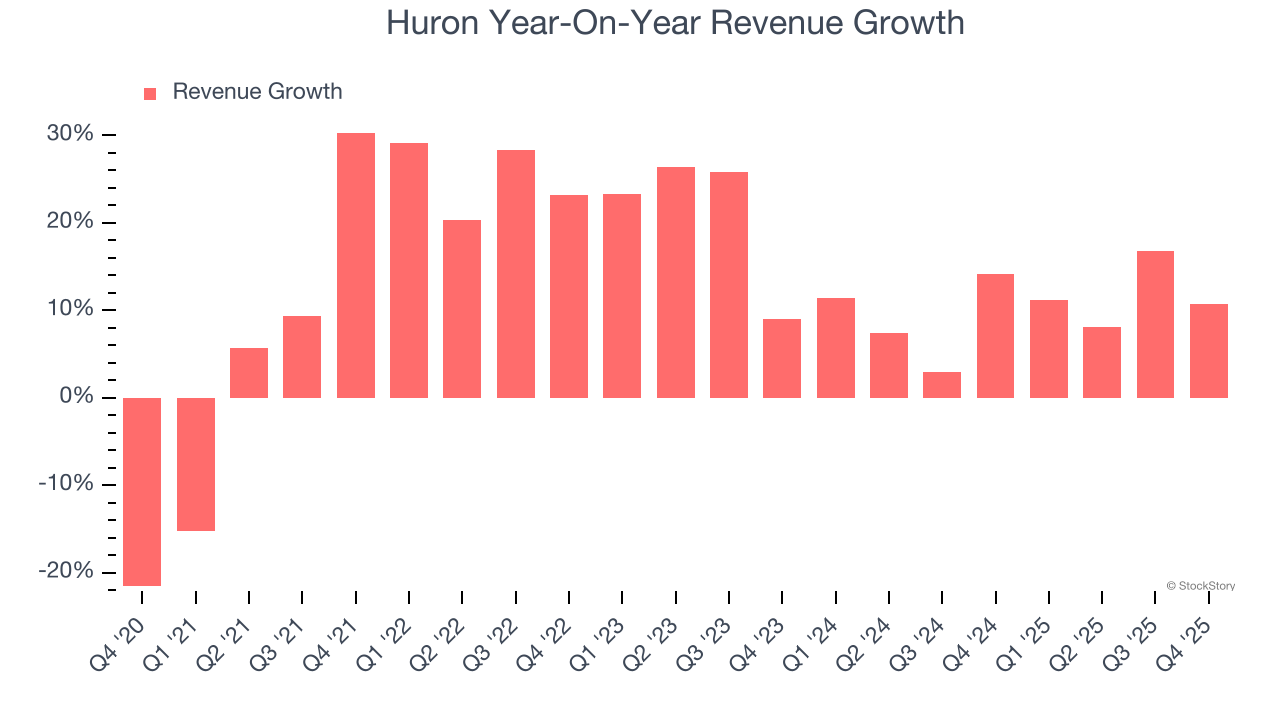
This quarter, Huron’s revenue grew by 10.7% year on year to $442 million but fell short of Wall Street’s estimates.
Looking ahead, sell-side analysts expect revenue to grow 10.2% over the next 12 months, similar to its two-year rate. This projection is noteworthy and indicates the market is baking in success for its products and services.
Software is eating the world and there is virtually no industry left that has been untouched by it. That drives increasing demand for tools helping software developers do their jobs, whether it be monitoring critical cloud infrastructure, integrating audio and video functionality, or ensuring smooth content streaming. Click here to access a free report on our 3 favorite stocks to play this generational megatrend.
Operating Margin
Huron was profitable over the last five years but held back by its large cost base. Its average operating margin of 9.3% was weak for a business services business.
On the plus side, Huron’s operating margin rose by 4.8 percentage points over the last five years, as its sales growth gave it operating leverage.
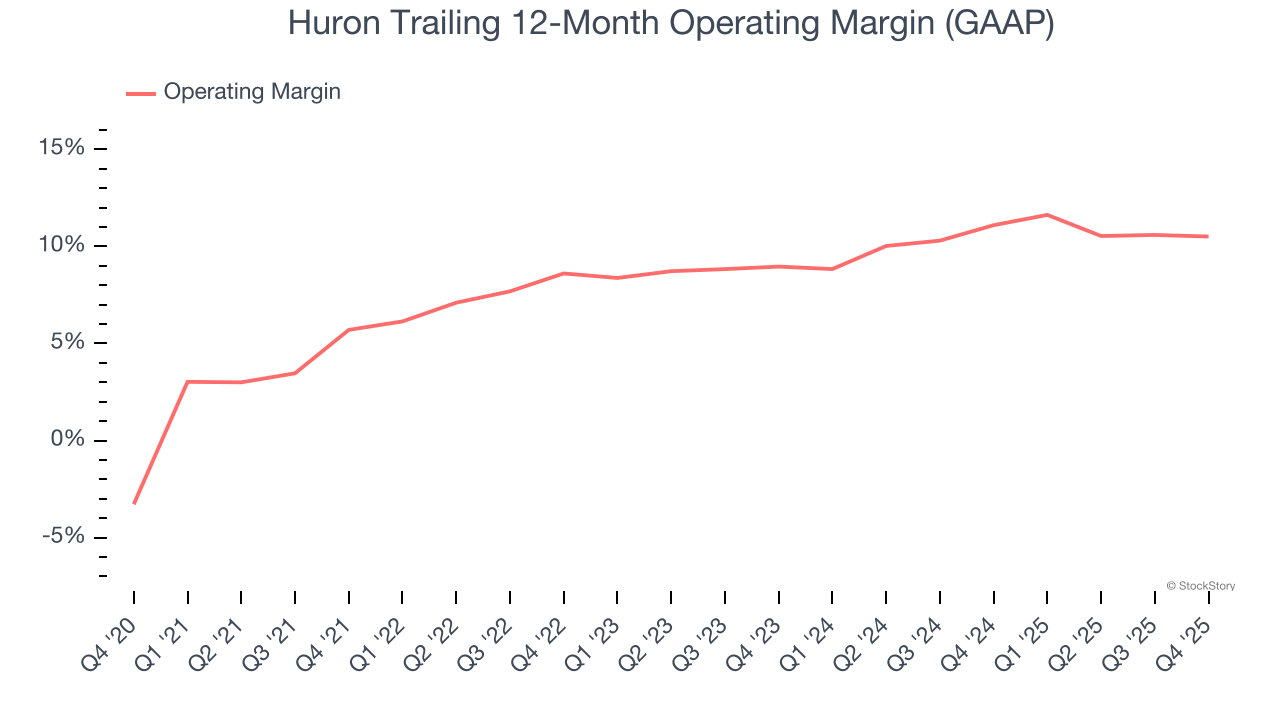
This quarter, Huron generated an operating margin profit margin of 11.4%, in line with the same quarter last year. This indicates the company’s overall cost structure has been relatively stable.
Earnings Per Share
We track the long-term change in earnings per share (EPS) for the same reason as long-term revenue growth. Compared to revenue, however, EPS highlights whether a company’s growth is profitable.
Huron’s EPS grew at an astounding 29.4% compounded annual growth rate over the last five years, higher than its 14.3% annualized revenue growth. This tells us the company became more profitable on a per-share basis as it expanded.
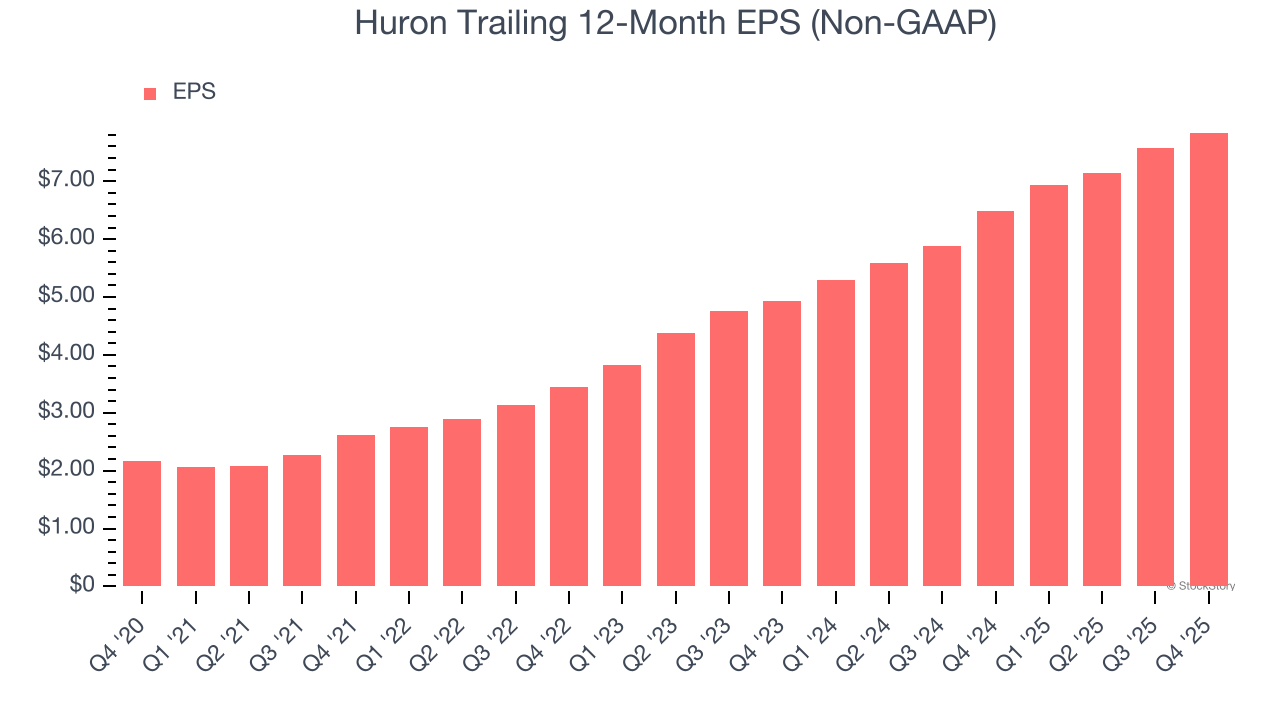
We can take a deeper look into Huron’s earnings quality to better understand the drivers of its performance. As we mentioned earlier, Huron’s operating margin was flat this quarter but expanded by 4.8 percentage points over the last five years. On top of that, its share count shrank by 18.5%. These are positive signs for shareholders because improving profitability and share buybacks turbocharge EPS growth relative to revenue growth. 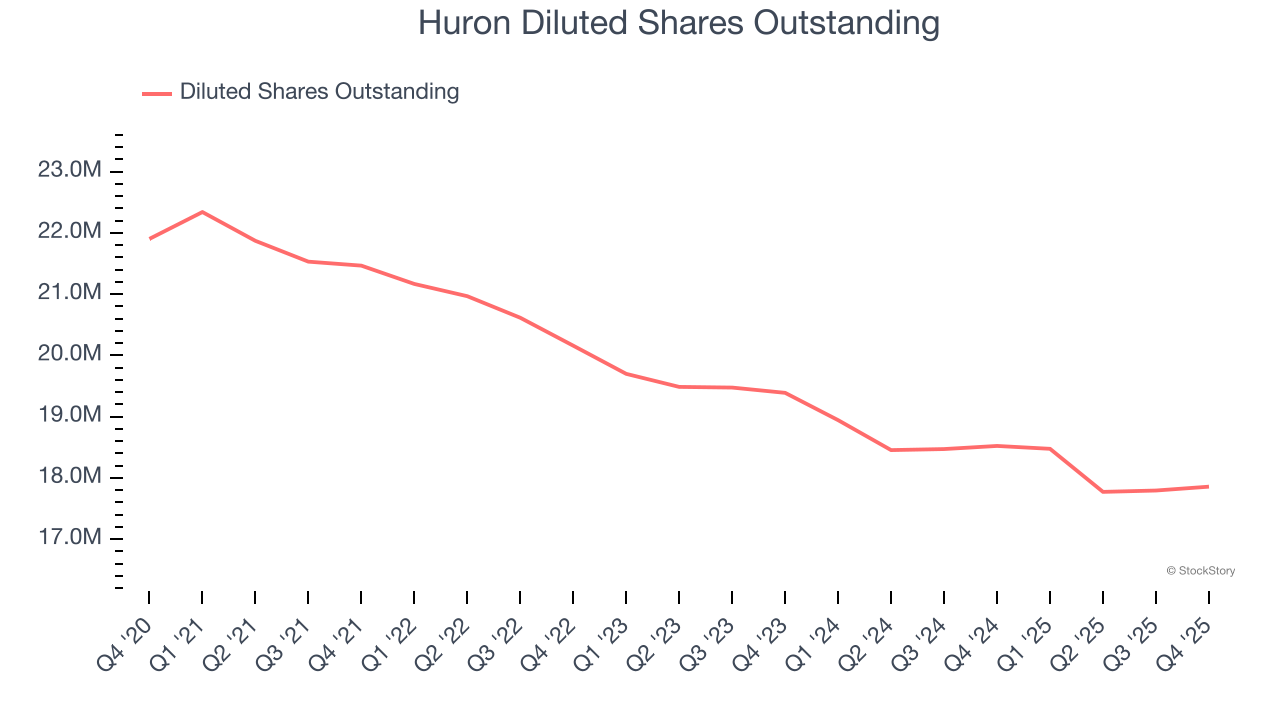
Like with revenue, we analyze EPS over a shorter period to see if we are missing a change in the business.
For Huron, its two-year annual EPS growth of 26.1% was lower than its five-year trend. We still think its growth was good and hope it can accelerate in the future.
In Q4, Huron reported adjusted EPS of $2.17, up from $1.90 in the same quarter last year. This print easily cleared analysts’ estimates, and shareholders should be content with the results. Over the next 12 months, Wall Street expects Huron’s full-year EPS of $7.84 to grow 12.2%.
Key Takeaways from Huron’s Q4 Results
It was good to see Huron beat analysts’ EPS expectations this quarter. On the other hand, its revenue slightly missed. Overall, this print had some key positives. Investors were likely hoping for more, and shares traded down 2% to $123.61 immediately following the results.
Is Huron an attractive investment opportunity right now? If you’re making that decision, you should consider the bigger picture of valuation, business qualities, as well as the latest earnings. We cover that in our actionable full research report which you can read here (it’s free).


