
Financial services provider CBIZ (NYSE: CBZ) missed Wall Street’s revenue expectations in Q4 CY2025, but sales rose 17.9% year on year to $542.7 million. The company’s full-year revenue guidance of $2.85 billion at the midpoint came in 1.8% below analysts’ estimates. Its non-GAAP loss of $0.70 per share was 6.2% below analysts’ consensus estimates.
Is now the time to buy CBIZ? Find out by accessing our full research report, it’s free.
CBIZ (CBZ) Q4 CY2025 Highlights:
- Revenue: $542.7 million vs analyst estimates of $578 million (17.9% year-on-year growth, 6.1% miss)
- Adjusted EPS: -$0.70 vs analyst expectations of -$0.66 (6.2% miss)
- Adjusted EBITDA: -$28.7 million (-5.3% margin, 61.9% year-on-year growth)
- Adjusted EPS guidance for the upcoming financial year 2026 is $3.80 at the midpoint, missing analyst estimates by 1.2%
- EBITDA guidance for the upcoming financial year 2026 is $455 million at the midpoint, below analyst estimates of $457.9 million
- Operating Margin: -15.7%, down from -11.6% in the same quarter last year
- Market Capitalization: $1.49 billion
Company Overview
With over 120 offices across 33 states and a team of more than 6,700 professionals, CBIZ (NYSE: CBZ) provides accounting, tax, benefits, insurance brokerage, and advisory services to help small and mid-sized businesses manage their finances and operations.
Revenue Growth
A company’s long-term sales performance is one signal of its overall quality. Any business can have short-term success, but a top-tier one grows for years.
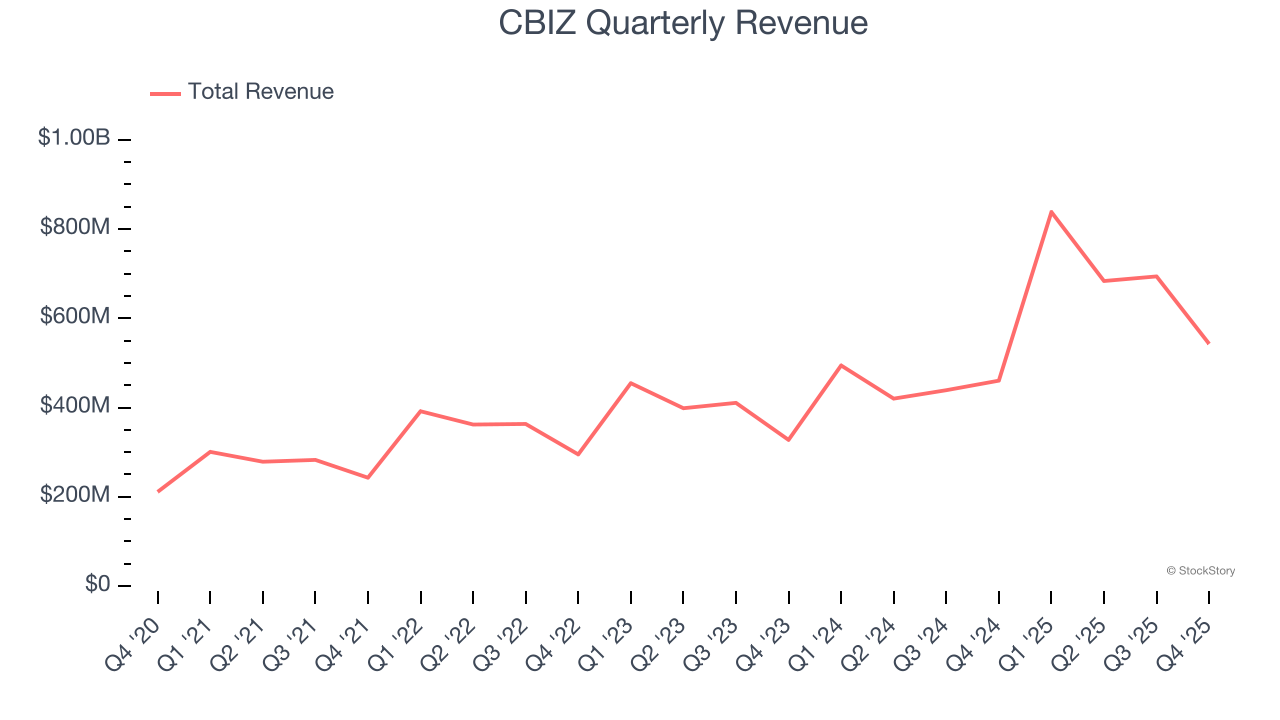
With $2.76 billion in revenue over the past 12 months, CBIZ is a mid-sized business services company, which sometimes brings disadvantages compared to larger competitors benefiting from better economies of scale. On the bright side, it can still flex high growth rates because it’s working from a smaller revenue base.
As you can see below, CBIZ’s sales grew at an incredible 23.4% compounded annual growth rate over the last five years. This is a great starting point for our analysis because it shows CBIZ’s demand was higher than many business services companies.
We at StockStory place the most emphasis on long-term growth, but within business services, a half-decade historical view may miss recent innovations or disruptive industry trends. CBIZ’s annualized revenue growth of 31.7% over the last two years is above its five-year trend, suggesting its demand was strong and recently accelerated. 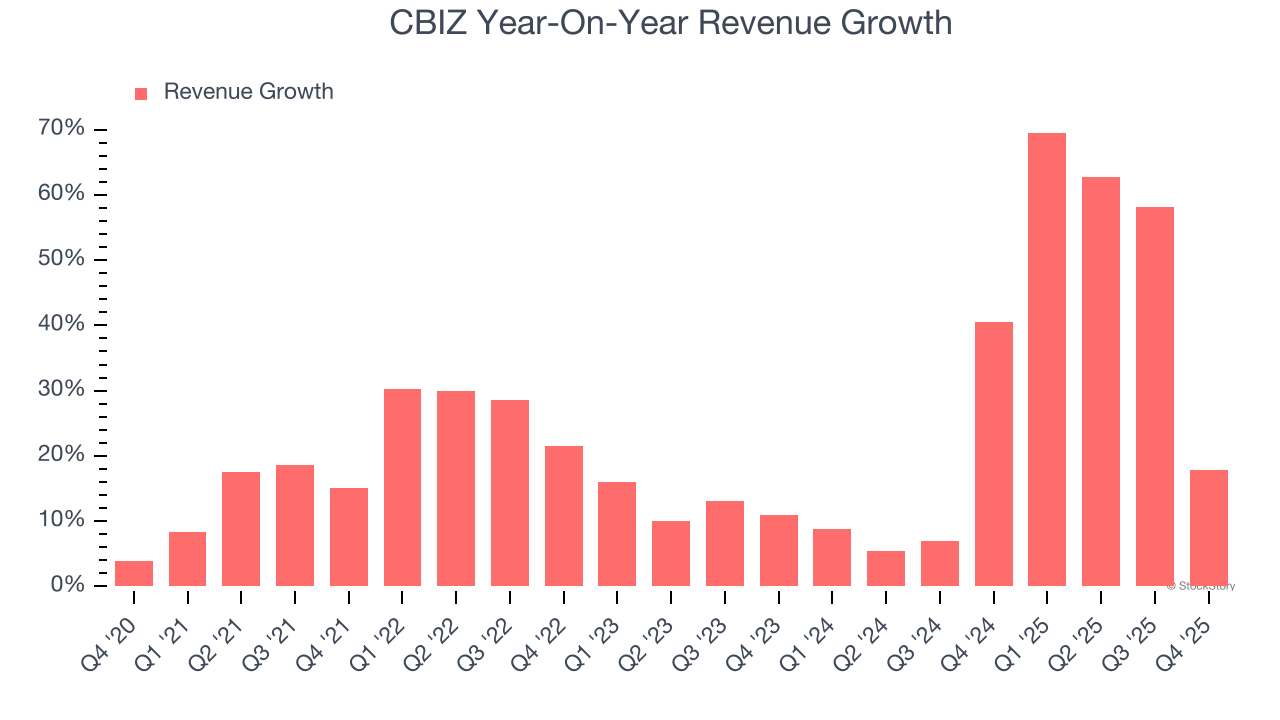
This quarter, CBIZ’s revenue grew by 17.9% year on year to $542.7 million but fell short of Wall Street’s estimates.
Looking ahead, sell-side analysts expect revenue to grow 4.7% over the next 12 months, a deceleration versus the last two years. This projection is underwhelming and implies its products and services will see some demand headwinds. At least the company is tracking well in other measures of financial health.
Software is eating the world and there is virtually no industry left that has been untouched by it. That drives increasing demand for tools helping software developers do their jobs, whether it be monitoring critical cloud infrastructure, integrating audio and video functionality, or ensuring smooth content streaming. Click here to access a free report on our 3 favorite stocks to play this generational megatrend.
Operating Margin
Operating margin is one of the best measures of profitability because it tells us how much money a company takes home after subtracting all core expenses, like marketing and R&D.
CBIZ’s operating margin has risen over the last 12 months and averaged 10% over the last five years. Although its profitability is still mediocre, we can see its elite revenue growth is giving it operating leverage as it scales. This gives it a shot at higher long-term profits if it can keep expanding.
Analyzing the trend in its profitability, CBIZ’s operating margin might fluctuated slightly but has generally stayed the same over the last five years. This raises questions about the company’s expense base because its revenue growth should have given it leverage on its fixed costs, resulting in better economies of scale and profitability.
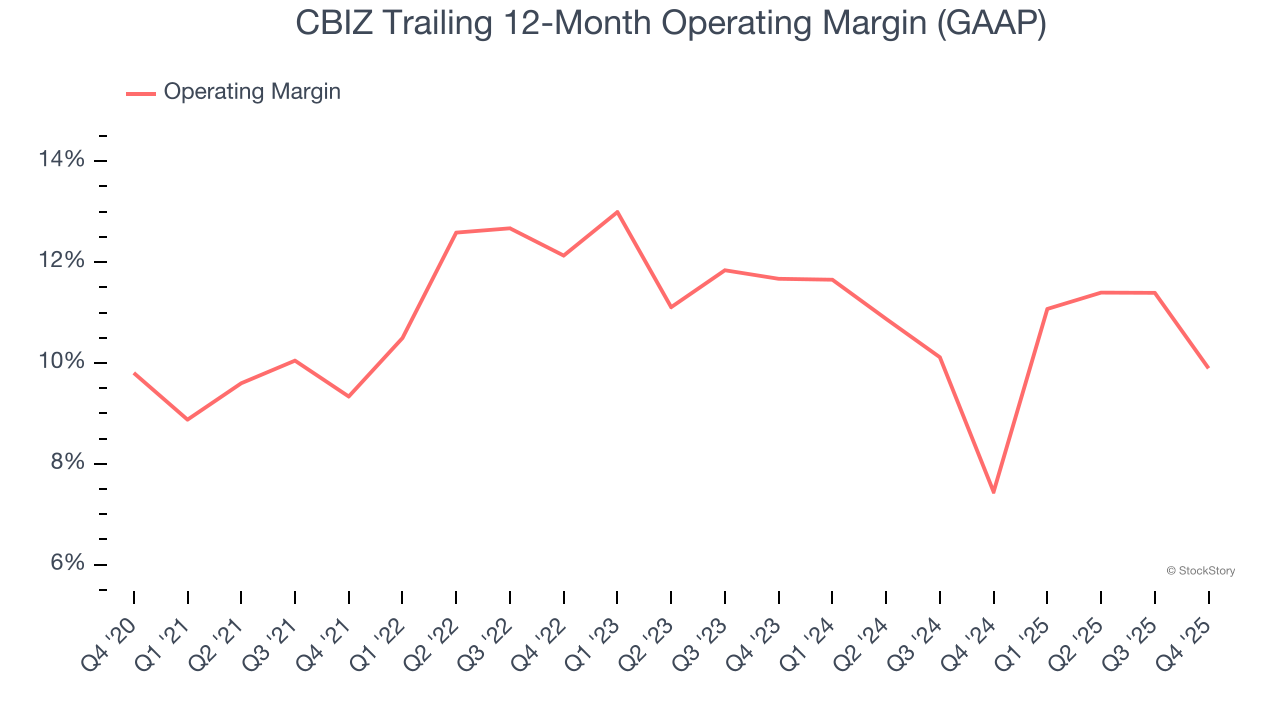
In Q4, CBIZ generated an operating margin profit margin of negative 15.7%, down 4.1 percentage points year on year. This contraction shows it was less efficient because its expenses grew faster than its revenue.
Earnings Per Share
Revenue trends explain a company’s historical growth, but the long-term change in earnings per share (EPS) points to the profitability of that growth – for example, a company could inflate its sales through excessive spending on advertising and promotions.
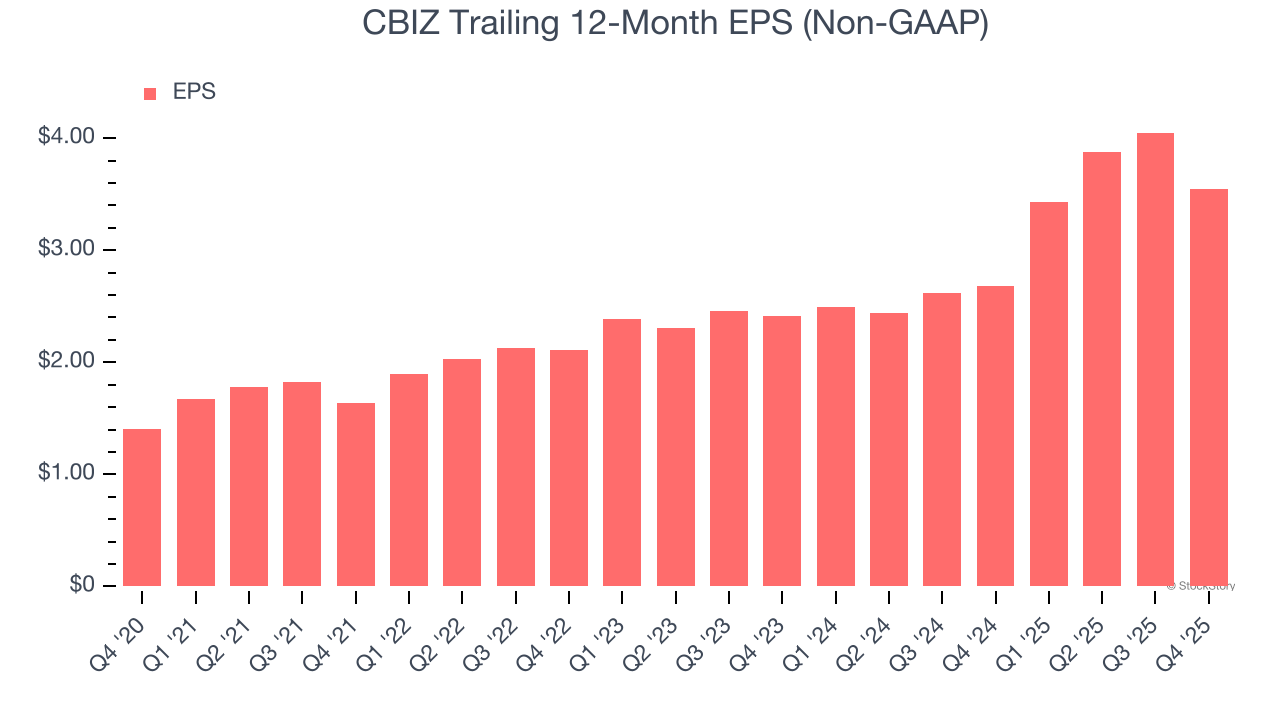
CBIZ’s EPS grew at an astounding 20.3% compounded annual growth rate over the last five years. However, this performance was lower than its 23.4% annualized revenue growth, telling us the company became less profitable on a per-share basis as it expanded.
Like with revenue, we analyze EPS over a shorter period to see if we are missing a change in the business.
For CBIZ, its two-year annual EPS growth of 21.4% was higher than its five-year trend. We love it when earnings growth accelerates, especially when it accelerates off an already high base.
In Q4, CBIZ reported adjusted EPS of negative $0.70, down from negative $0.20 in the same quarter last year. This print missed analysts’ estimates, but we care more about long-term adjusted EPS growth than short-term movements. Over the next 12 months, Wall Street expects CBIZ’s full-year EPS of $3.55 to grow 7.8%.
Key Takeaways from CBIZ’s Q4 Results
We struggled to find many positives in these results. Its revenue missed and its EPS fell short of Wall Street’s estimates. Overall, this quarter could have been better. The stock traded up 3.6% to $28.32 immediately following the results.
Is CBIZ an attractive investment opportunity at the current price? We think that the latest quarter is only one piece of the longer-term business quality puzzle. Quality, when combined with valuation, can help determine if the stock is a buy. We cover that in our actionable full research report which you can read here (it’s free).


