
Healthcare services company Chemed Corporation (NYSE: CHE) fell short of the market’s revenue expectations in Q4 CY2025, with sales flat year on year at $639.3 million. Its non-GAAP profit of $6.42 per share was 8.7% below analysts’ consensus estimates.
Is now the time to buy Chemed? Find out by accessing our full research report, it’s free.
Chemed (CHE) Q4 CY2025 Highlights:
- Revenue: $639.3 million vs analyst estimates of $659.1 million (flat year on year, 3% miss)
- Adjusted EPS: $6.42 vs analyst expectations of $7.03 (8.7% miss)
- Adjusted EBITDA: $132.6 million vs analyst estimates of $144.2 million (20.7% margin, 8% miss)
- Adjusted EPS guidance for the upcoming financial year 2026 is $23.75 at the midpoint, missing analyst estimates by 6.5%
- Operating Margin: 15.7%, down from 17.8% in the same quarter last year
- Free Cash Flow Margin: 18.3%, down from 23.8% in the same quarter last year
- Sales Volumes rose 1.3% year on year (14.6% in the same quarter last year)
- Market Capitalization: $6.61 billion
Company Overview
With a unique business model combining end-of-life care and household services, Chemed (NYSE: CHE) operates two distinct businesses: VITAS, which provides hospice care for terminally ill patients, and Roto-Rooter, which offers plumbing and water restoration services.
Revenue Growth
Reviewing a company’s long-term sales performance reveals insights into its quality. Any business can put up a good quarter or two, but the best consistently grow over the long haul. Over the last five years, Chemed grew its sales at a tepid 4% compounded annual growth rate. This was below our standard for the healthcare sector and is a rough starting point for our analysis.
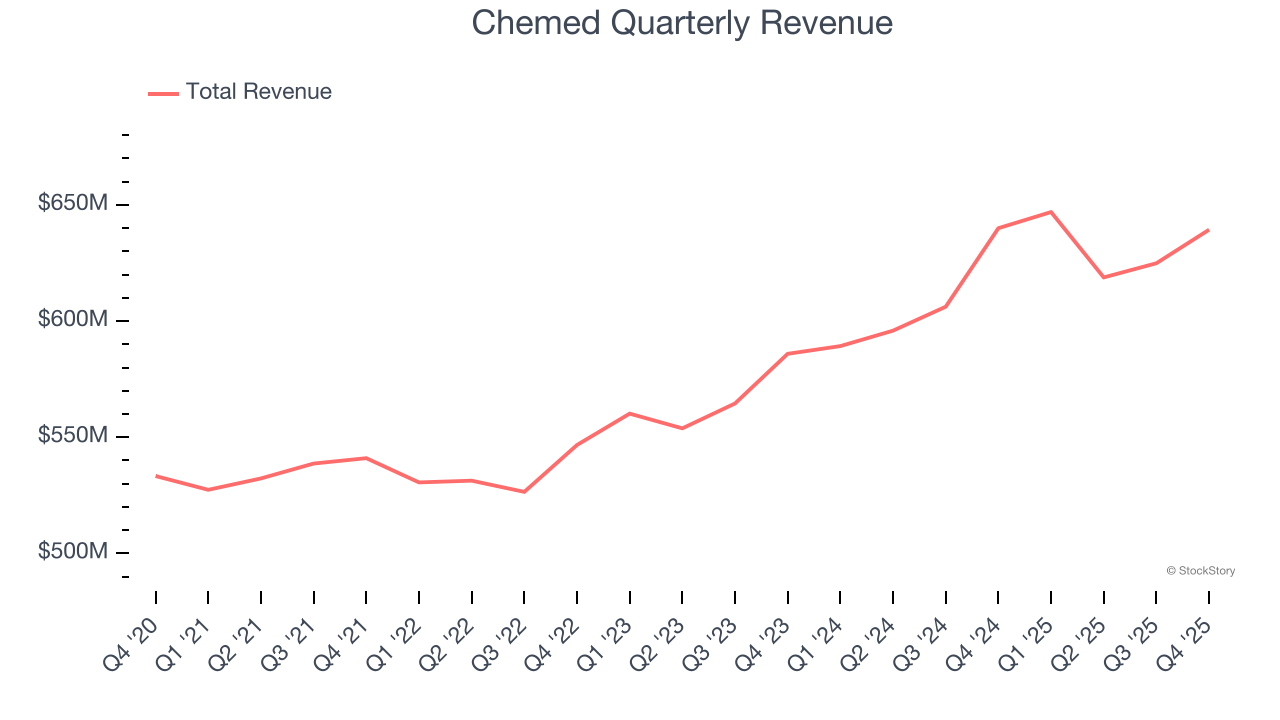
Long-term growth is the most important, but within healthcare, a half-decade historical view may miss new innovations or demand cycles. Chemed’s annualized revenue growth of 5.7% over the last two years is above its five-year trend, which is encouraging. 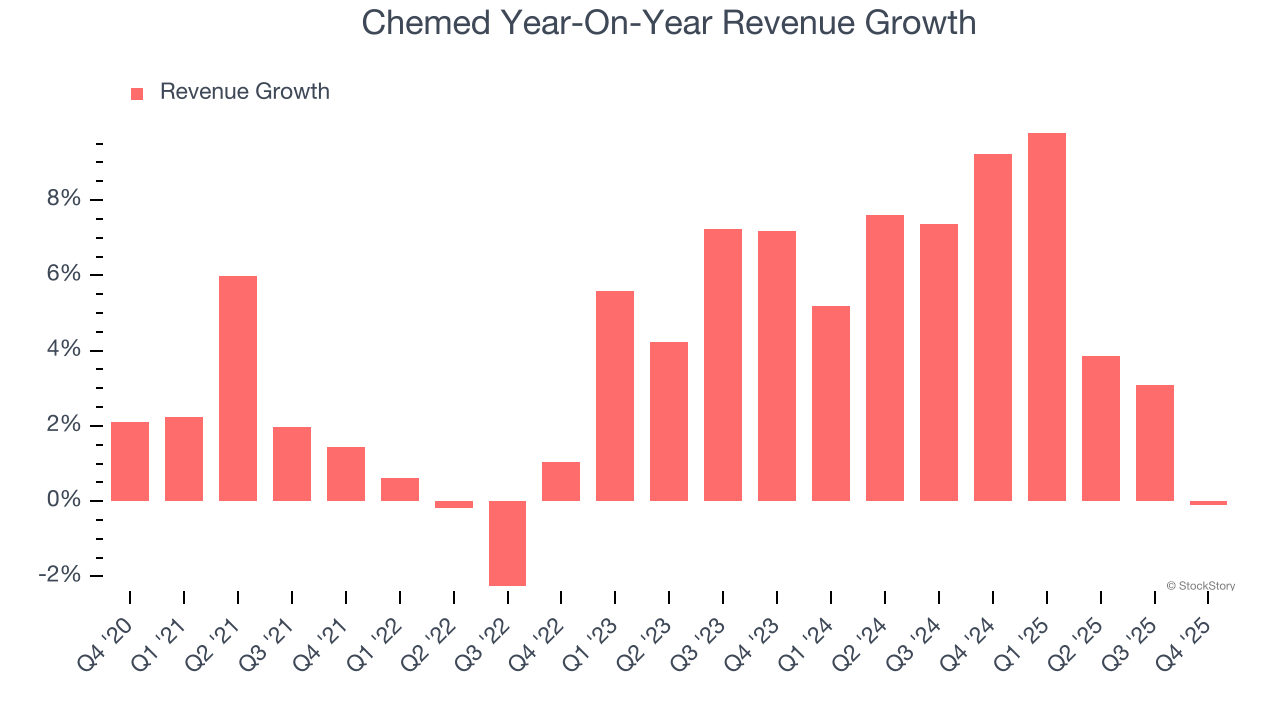
We can dig further into the company’s revenue dynamics by analyzing its number of billable days, which reached 2.07 million in the latest quarter. Over the last two years, Chemed’s billable days averaged 7.3% year-on-year growth. Because this number is better than its revenue growth, we can see the company’s average selling price decreased. 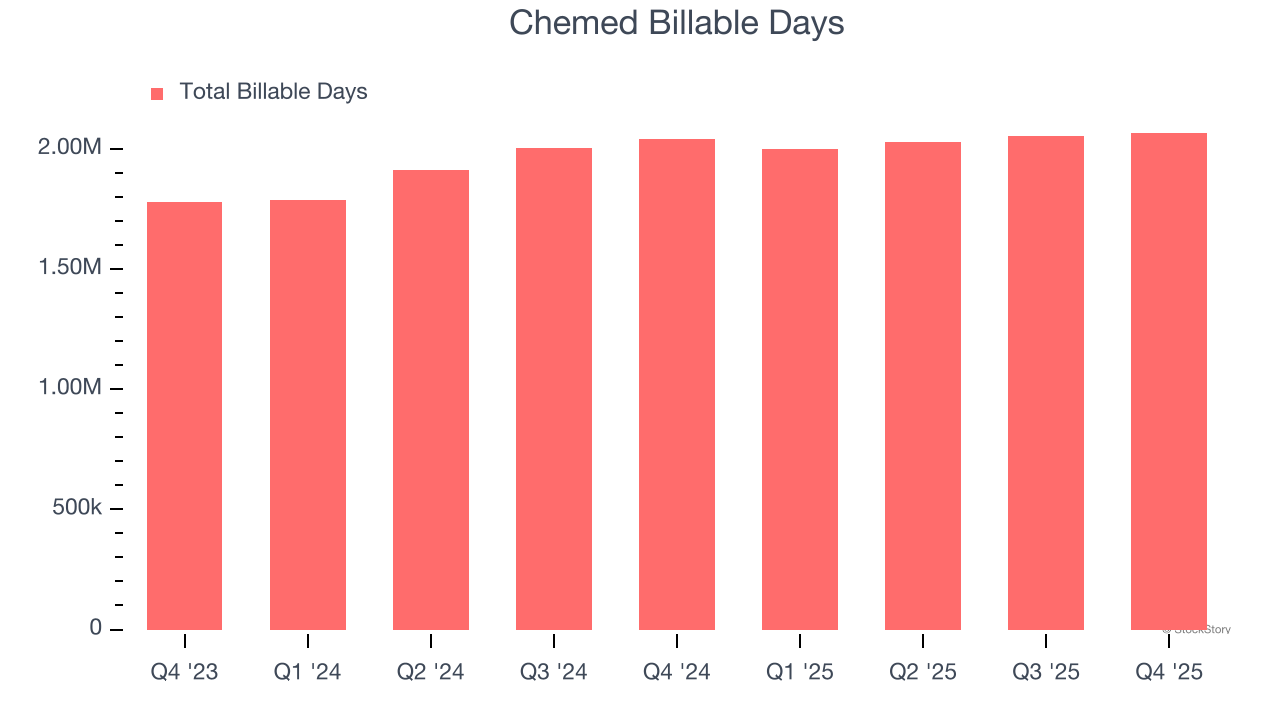
This quarter, Chemed missed Wall Street’s estimates and reported a rather uninspiring 0.1% year-on-year revenue decline, generating $639.3 million of revenue.
Looking ahead, sell-side analysts expect revenue to grow 6.9% over the next 12 months, similar to its two-year rate. This projection is above the sector average and implies its newer products and services will catalyze better top-line performance.
Microsoft, Alphabet, Coca-Cola, Monster Beverage—all began as under-the-radar growth stories riding a massive trend. We’ve identified the next one: a profitable AI semiconductor play Wall Street is still overlooking. Go here for access to our full report.
Operating Margin
Chemed has managed its cost base well over the last five years. It demonstrated solid profitability for a healthcare business, producing an average operating margin of 15.1%.
Analyzing the trend in its profitability, Chemed’s operating margin decreased by 2.7 percentage points over the last five years. The company’s two-year trajectory also shows it failed to get its profitability back to the peak as its margin fell by 1.7 percentage points. This performance was poor no matter how you look at it - it shows its expenses were rising and it couldn’t pass those costs onto its customers.
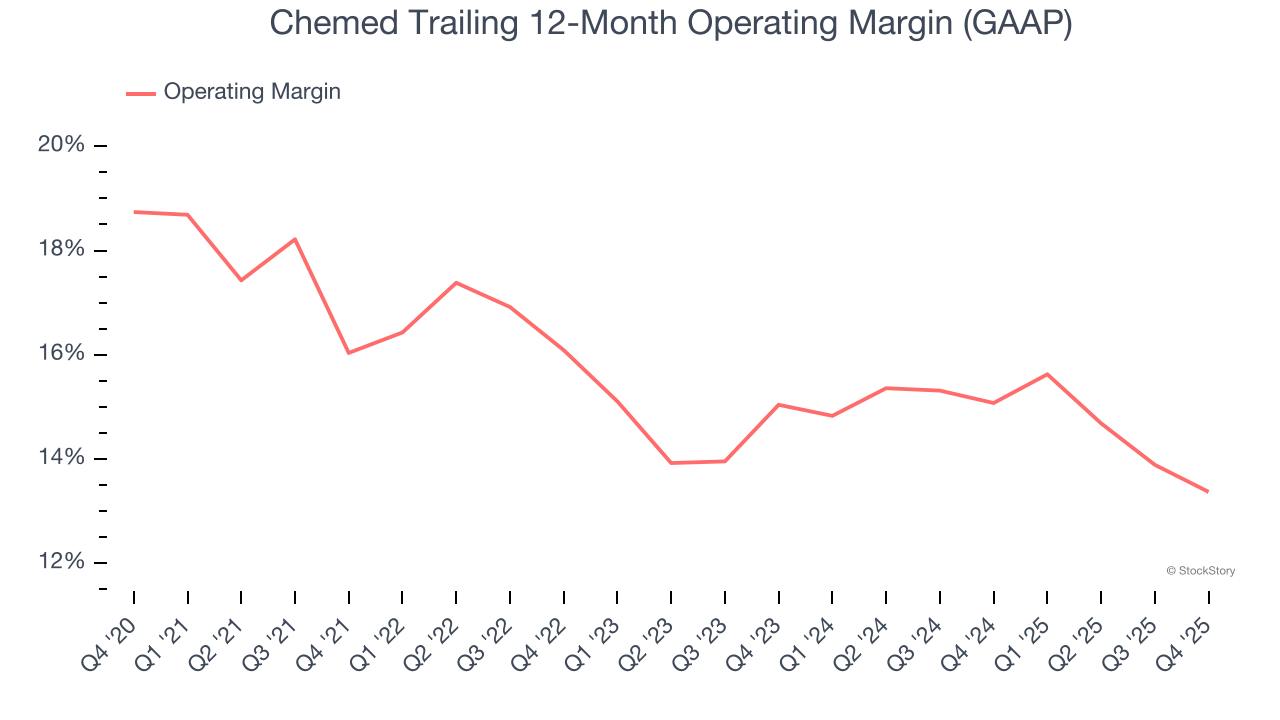
This quarter, Chemed generated an operating margin profit margin of 15.7%, down 2.1 percentage points year on year. This contraction shows it was less efficient because its expenses increased relative to its revenue.
Earnings Per Share
We track the long-term change in earnings per share (EPS) for the same reason as long-term revenue growth. Compared to revenue, however, EPS highlights whether a company’s growth is profitable.
Chemed’s unimpressive 3.6% annual EPS growth over the last five years aligns with its revenue performance. This tells us it maintained its per-share profitability as it expanded.
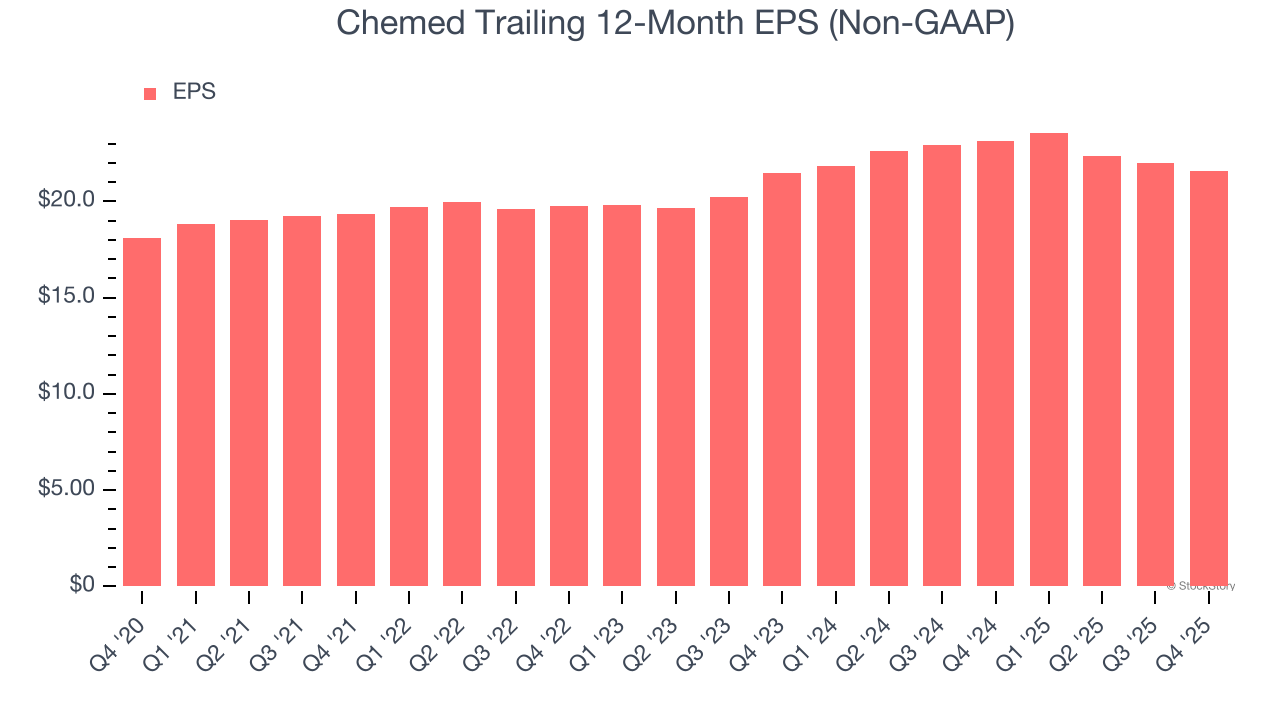
In Q4, Chemed reported adjusted EPS of $6.42, down from $6.83 in the same quarter last year. This print missed analysts’ estimates. Over the next 12 months, Wall Street expects Chemed’s full-year EPS of $21.59 to grow 15.9%.
Key Takeaways from Chemed’s Q4 Results
We struggled to find many positives in these results. Its full-year EPS guidance missed and its revenue fell short of Wall Street’s estimates. Overall, this was a softer quarter. The stock traded down 14.7% to $397.97 immediately after reporting.
Chemed may have had a tough quarter, but does that actually create an opportunity to invest right now? If you’re making that decision, you should consider the bigger picture of valuation, business qualities, as well as the latest earnings. We cover that in our actionable full research report which you can read here (it’s free).


