
Multinational media and entertainment corporation Paramount (NASDAQ: PSKY) met Wall Street’s revenue expectations in Q4 CY2025, but sales fell by 5.1% year on year to $8.15 billion. On the other hand, next quarter’s revenue guidance of $7.25 billion was less impressive, coming in 2.3% below analysts’ estimates. Its GAAP loss of $0.52 per share was significantly below analysts’ consensus estimates.
Is now the time to buy Paramount? Find out by accessing our full research report, it’s free.
Paramount (PSKY) Q4 CY2025 Highlights:
- Revenue: $8.15 billion vs analyst estimates of $8.14 billion (5.1% year-on-year decline, in line)
- EPS (GAAP): -$0.52 vs analyst estimates of -$0.20 (significant miss)
- Adjusted EBITDA: $612 million vs analyst estimates of $564 million (7.5% margin, 8.5% beat)
- Revenue Guidance for Q1 CY2026 is $7.25 billion at the midpoint, below analyst estimates of $7.42 billion
- EBITDA guidance for the upcoming financial year 2026 is $3.8 billion at the midpoint, above analyst estimates of $3.51 billion
- Operating Margin: -4.2%, down from 1.5% in the same quarter last year
- Free Cash Flow Margin: 1.2%, similar to the same quarter last year
- Market Capitalization: $11.4 billion
Company Overview
Owner of Spongebob Squarepants and formerly known as ViacomCBS, Paramount Global (NASDAQ: PARA) is a major media conglomerate offering television, film production, and digital content across various global platforms.
Revenue Growth
A company’s long-term performance is an indicator of its overall quality. Any business can have short-term success, but a top-tier one grows for years. Regrettably, Paramount’s sales grew at a weak 2.7% compounded annual growth rate over the last five years. This was below our standards and is a tough starting point for our analysis.
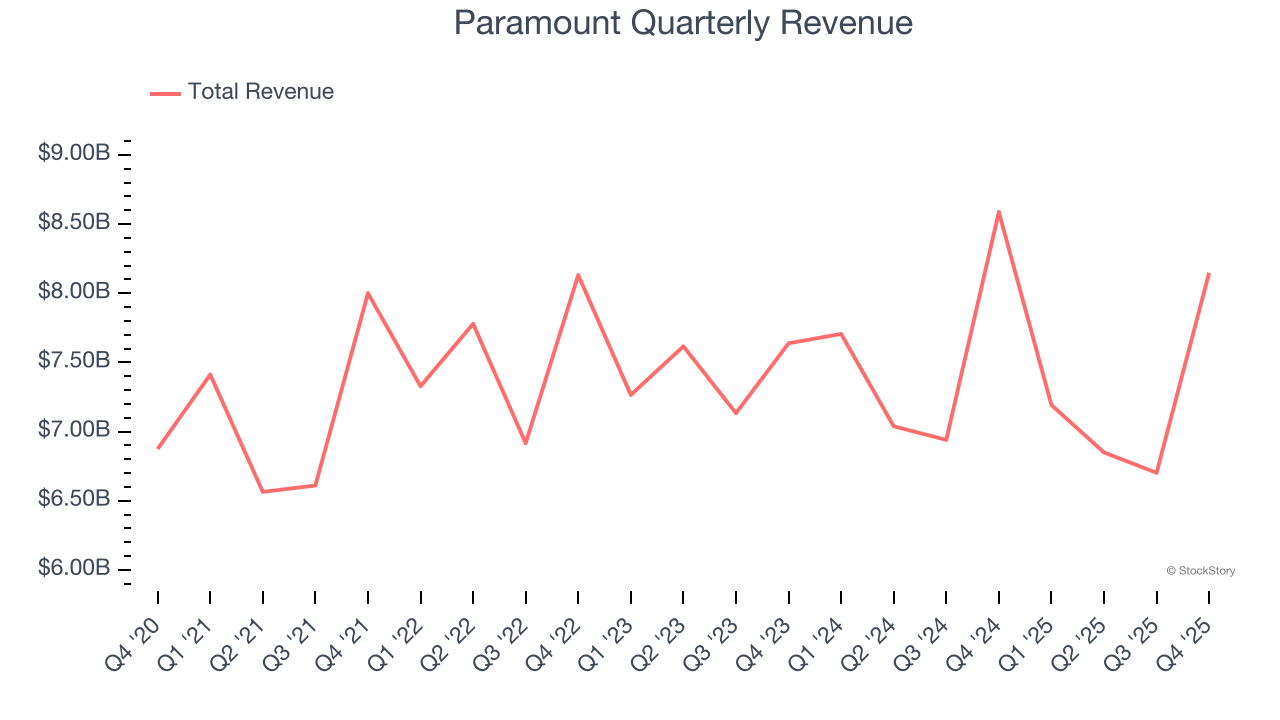
Long-term growth is the most important, but within consumer discretionary, product cycles are short and revenue can be hit-driven due to rapidly changing trends and consumer preferences. Paramount’s performance shows it grew in the past but relinquished its gains over the last two years, as its revenue fell by 1.3% annually. 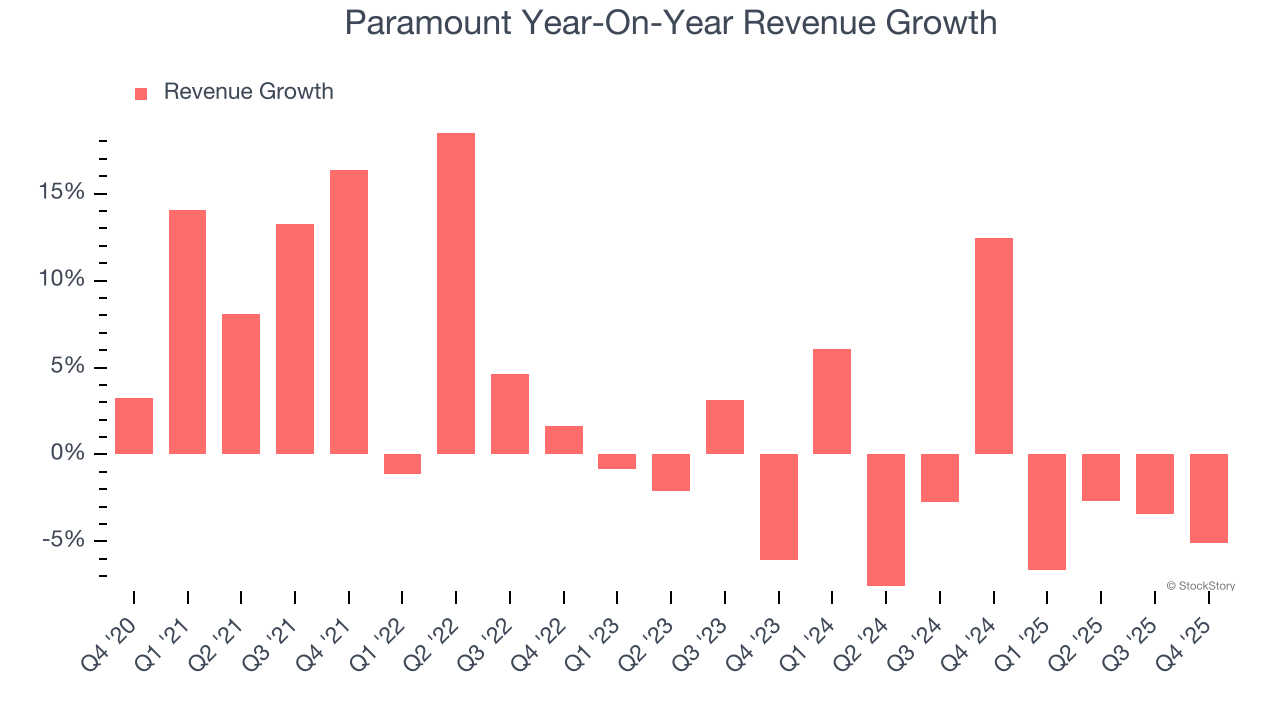
Paramount also breaks out the revenue for its three most important segments: TV Media, Direct-to-Consumer, and Filmed Entertainment, which are 57.9%, 27.2%, and 15.4% of revenue. Over the last two years, Paramount’s TV Media revenue (broadcasting) averaged 7.1% year-on-year declines, but its Direct-to-Consumer (streaming) and Filmed Entertainment (movies) revenues averaged 10.3% and 22.1% growth. 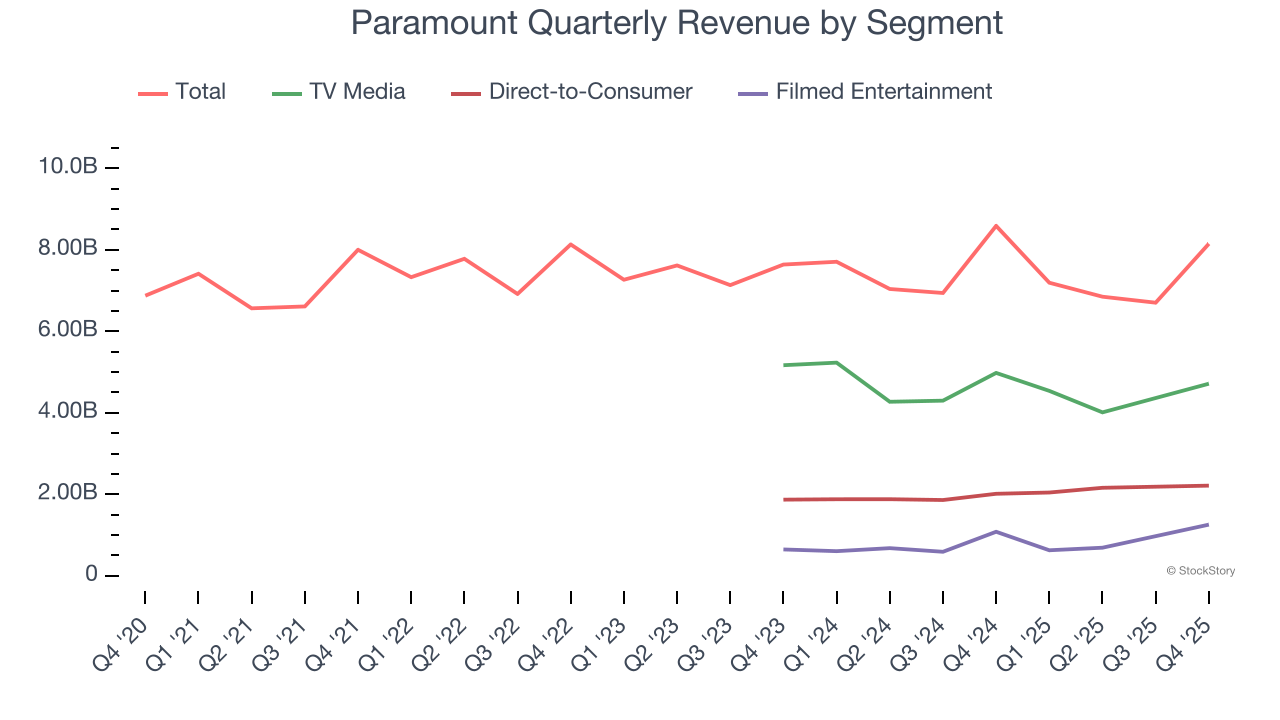
This quarter, Paramount reported a rather uninspiring 5.1% year-on-year revenue decline to $8.15 billion of revenue, in line with Wall Street’s estimates. Company management is currently guiding for flat sales next quarter.
Looking further ahead, sell-side analysts expect revenue to grow 3.8% over the next 12 months. While this projection suggests its newer products and services will spur better top-line performance, it is still below average for the sector.
The 1999 book Gorilla Game predicted Microsoft and Apple would dominate tech before it happened. Its thesis? Identify the platform winners early. Today, enterprise software companies embedding generative AI are becoming the new gorillas. a profitable, fast-growing enterprise software stock that is already riding the automation wave and looking to catch the generative AI next.
Operating Margin
Operating margin is an important measure of profitability as it shows the portion of revenue left after accounting for all core expenses – everything from the cost of goods sold to advertising and wages. It’s also useful for comparing profitability across companies with different levels of debt and tax rates because it excludes interest and taxes.
Paramount’s operating margin has been trending up over the last 12 months, but it still averaged negative 7.3% over the last two years. This is due to its large expense base and inefficient cost structure.
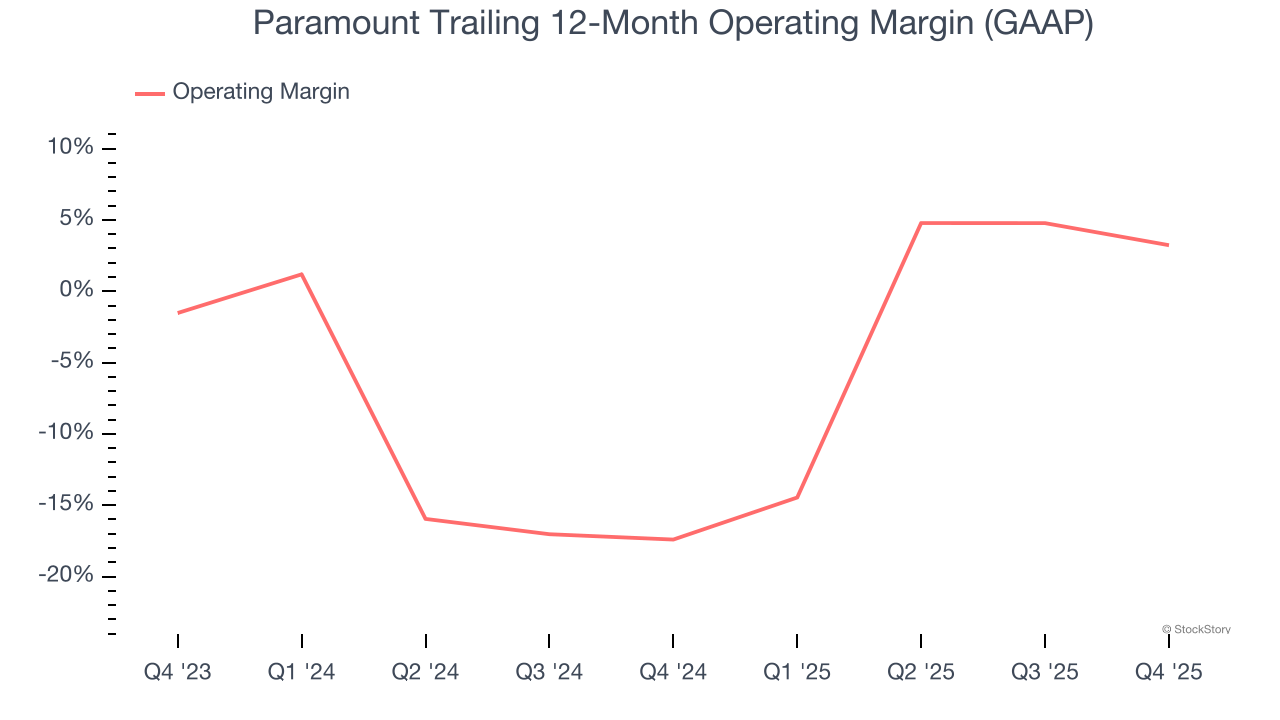
Paramount’s operating margin was negative 4.2% this quarter. The company's consistent lack of profits raise a flag.
Earnings Per Share
Revenue trends explain a company’s historical growth, but the long-term change in earnings per share (EPS) points to the profitability of that growth – for example, a company could inflate its sales through excessive spending on advertising and promotions.
Sadly for Paramount, its EPS declined by 16.2% annually over the last five years while its revenue grew by 2.7%. This tells us the company became less profitable on a per-share basis as it expanded.
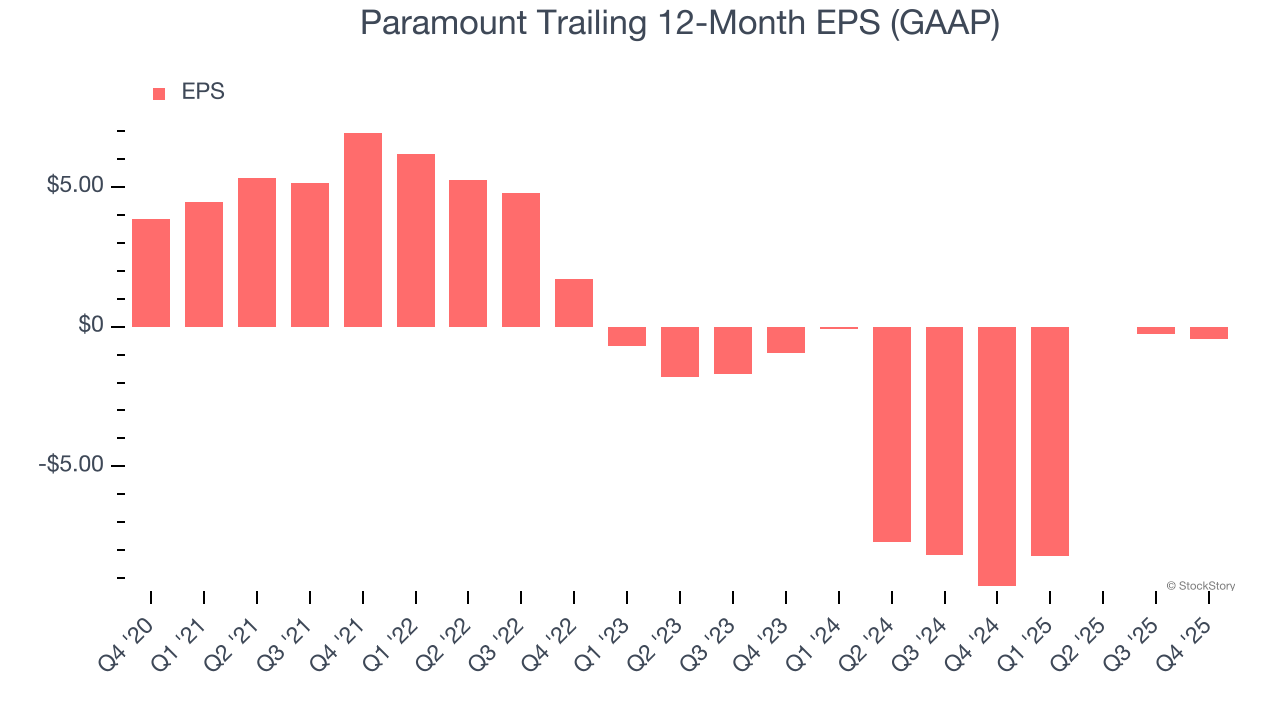
In Q4, Paramount reported EPS of negative $0.52, down from negative $0.33 in the same quarter last year. This print missed analysts’ estimates. Over the next 12 months, Wall Street is optimistic. Analysts forecast Paramount’s full-year EPS of negative $0.45 will flip to positive $0.60.
Key Takeaways from Paramount’s Q4 Results
It was great to see Paramount’s full-year EBITDA guidance top analysts’ expectations. We were also happy its EBITDA outperformed Wall Street’s estimates. On the other hand, its EPS missed and its revenue guidance for next quarter fell short of Wall Street’s estimates. Zooming out, we think this was a mixed quarter. The stock remained flat at $10.17 immediately after reporting.
So should you invest in Paramount right now? If you’re making that decision, you should consider the bigger picture of valuation, business qualities, as well as the latest earnings. We cover that in our actionable full research report which you can read here (it’s free).


