
Kitchen product manufacturer Middleby (NYSE: MIDD) missed Wall Street’s revenue expectations in Q4 CY2025, with sales falling 14.5% year on year to $866.4 million. Next quarter’s revenue guidance of $774 million underwhelmed, coming in 14% below analysts’ estimates. Its non-GAAP profit of $2.42 per share was 7.2% above analysts’ consensus estimates.
Is now the time to buy Middleby? Find out by accessing our full research report, it’s free.
Middleby (MIDD) Q4 CY2025 Highlights:
- Revenue: $866.4 million vs analyst estimates of $977.5 million (14.5% year-on-year decline, 11.4% miss)
- Adjusted EPS: $2.42 vs analyst estimates of $2.26 (7.2% beat)
- Adjusted EBITDA: $219.2 million vs analyst estimates of $204.9 million (25.3% margin, 7% beat)
- Revenue Guidance for Q1 CY2026 is $774 million at the midpoint, below analyst estimates of $899.8 million
- Adjusted EPS guidance for the upcoming financial year 2026 is $9.28 at the midpoint, missing analyst estimates by 1.9%
- EBITDA guidance for the upcoming financial year 2026 is $762.5 million at the midpoint, below analyst estimates of $820.2 million
- Operating Margin: 17.3%, in line with the same quarter last year
- Free Cash Flow Margin: 19.1%, down from 22.3% in the same quarter last year
- Organic Revenue was flat year on year (miss)
- Market Capitalization: $7.95 billion
Company Overview
Holding a Guinness World Record for creating the world’s fastest conveyor pizza oven, Middleby (NYSE: MIDD) is a food service and equipment manufacturer.
Revenue Growth
Examining a company’s long-term performance can provide clues about its quality. Even a bad business can shine for one or two quarters, but a top-tier one grows for years. Over the last five years, Middleby grew its sales at a decent 8.2% compounded annual growth rate. Its growth was slightly above the average industrials company and shows its offerings resonate with customers.
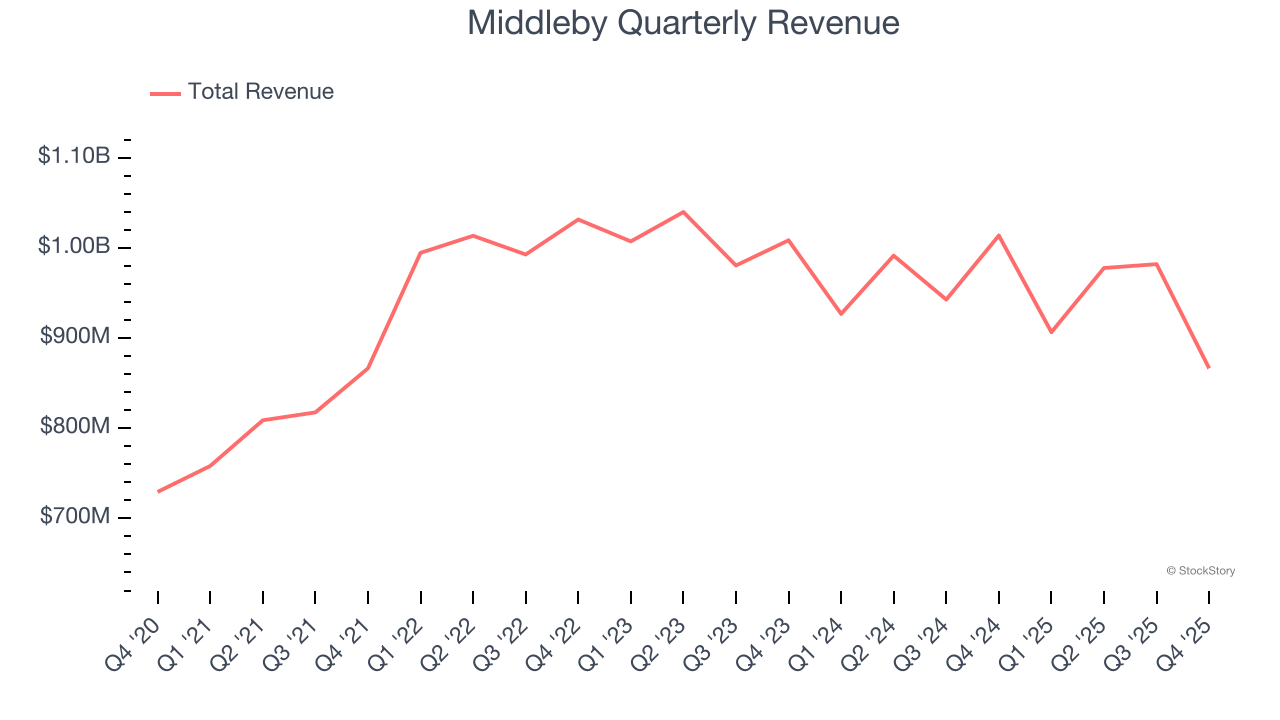
We at StockStory place the most emphasis on long-term growth, but within industrials, a half-decade historical view may miss cycles, industry trends, or a company capitalizing on catalysts such as a new contract win or a successful product line. Middleby’s recent performance marks a sharp pivot from its five-year trend as its revenue has shown annualized declines of 3.8% over the last two years. 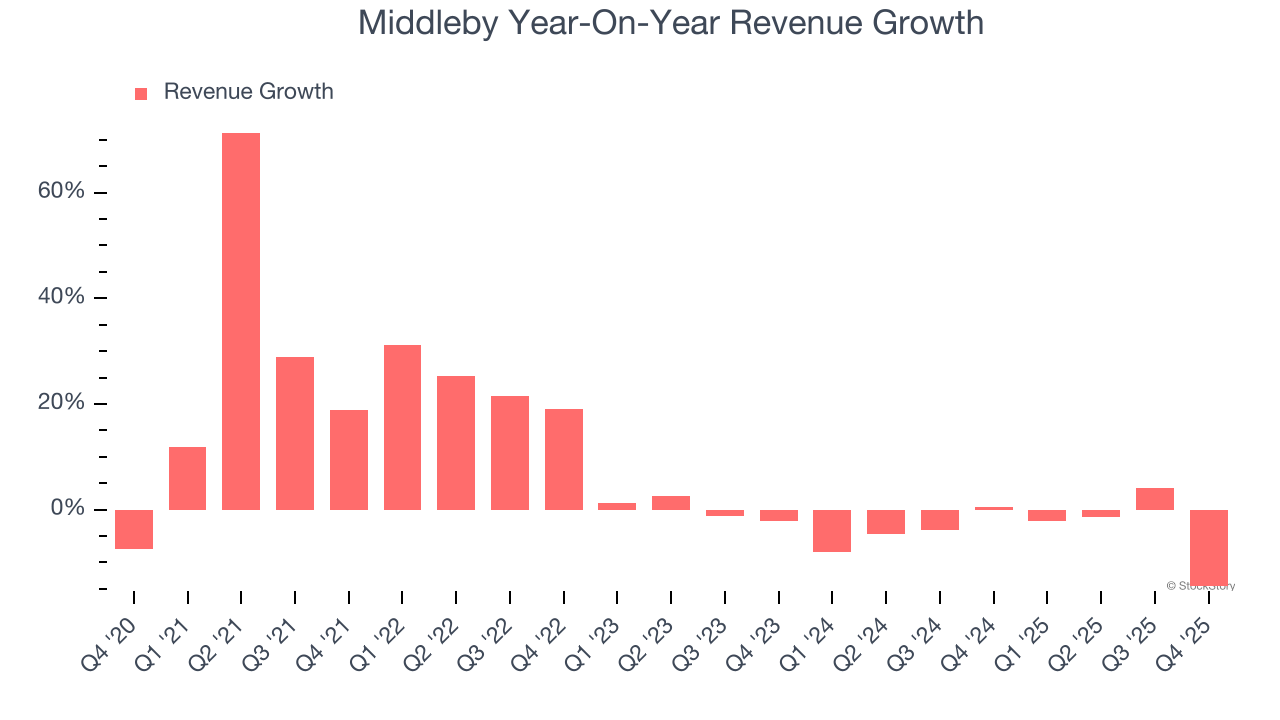
We can better understand the company’s sales dynamics by analyzing its organic revenue, which strips out one-time events like acquisitions and currency fluctuations that don’t accurately reflect its fundamentals. Over the last two years, Middleby’s organic revenue averaged 2.4% year-on-year declines. Because this number aligns with its two-year revenue growth, we can see the company’s core operations (not acquisitions and divestitures) drove most of its results. 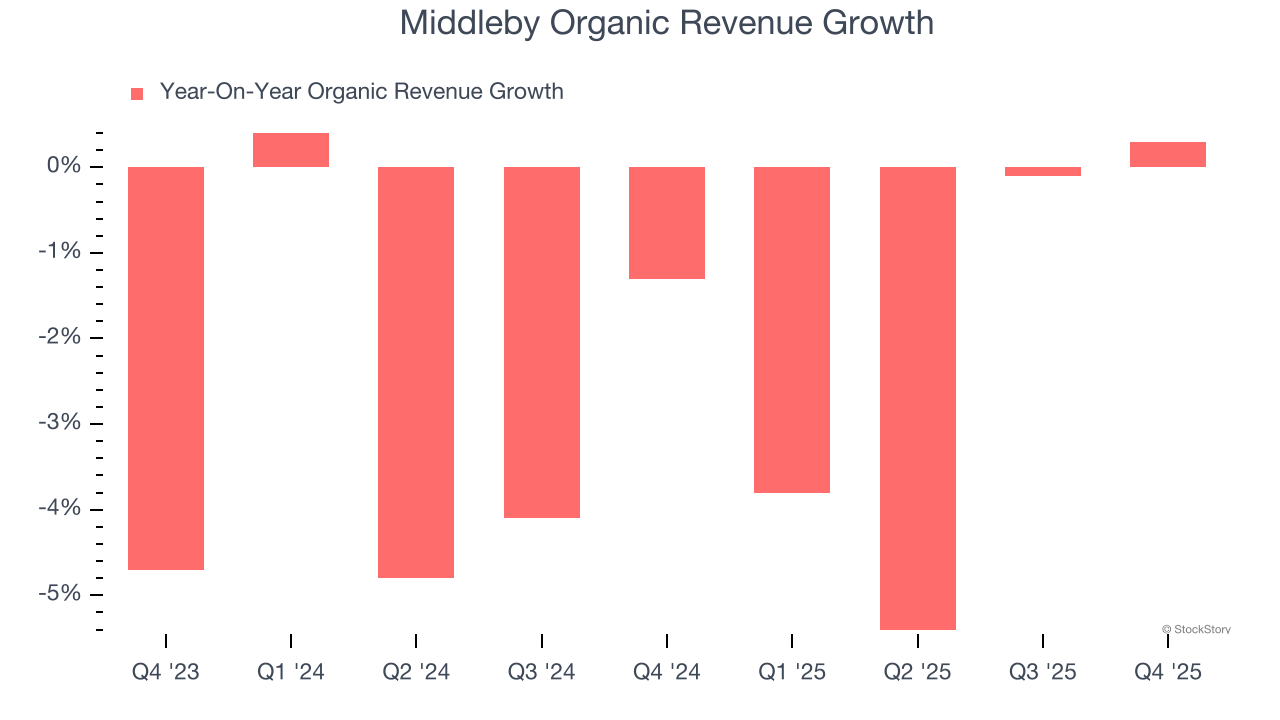
This quarter, Middleby missed Wall Street’s estimates and reported a rather uninspiring 14.5% year-on-year revenue decline, generating $866.4 million of revenue. Company management is currently guiding for a 14.6% year-on-year decline in sales next quarter.
Looking further ahead, sell-side analysts expect revenue to grow 3.8% over the next 12 months. Although this projection implies its newer products and services will catalyze better top-line performance, it is still below average for the sector.
Software is eating the world and there is virtually no industry left that has been untouched by it. That drives increasing demand for tools helping software developers do their jobs, whether it be monitoring critical cloud infrastructure, integrating audio and video functionality, or ensuring smooth content streaming. Click here to access a free report on our 3 favorite stocks to play this generational megatrend.
Operating Margin
Operating margin is a key measure of profitability. Think of it as net income - the bottom line - excluding the impact of taxes and interest on debt, which are less connected to business fundamentals.
Middleby has been an efficient company over the last five years. It was one of the more profitable businesses in the industrials sector, boasting an average operating margin of 13%. This result isn’t surprising as its high gross margin gives it a favorable starting point.
Analyzing the trend in its profitability, Middleby’s operating margin decreased by 22.3 percentage points over the last five years. This raises questions about the company’s expense base because its revenue growth should have given it leverage on its fixed costs, resulting in better economies of scale and profitability.
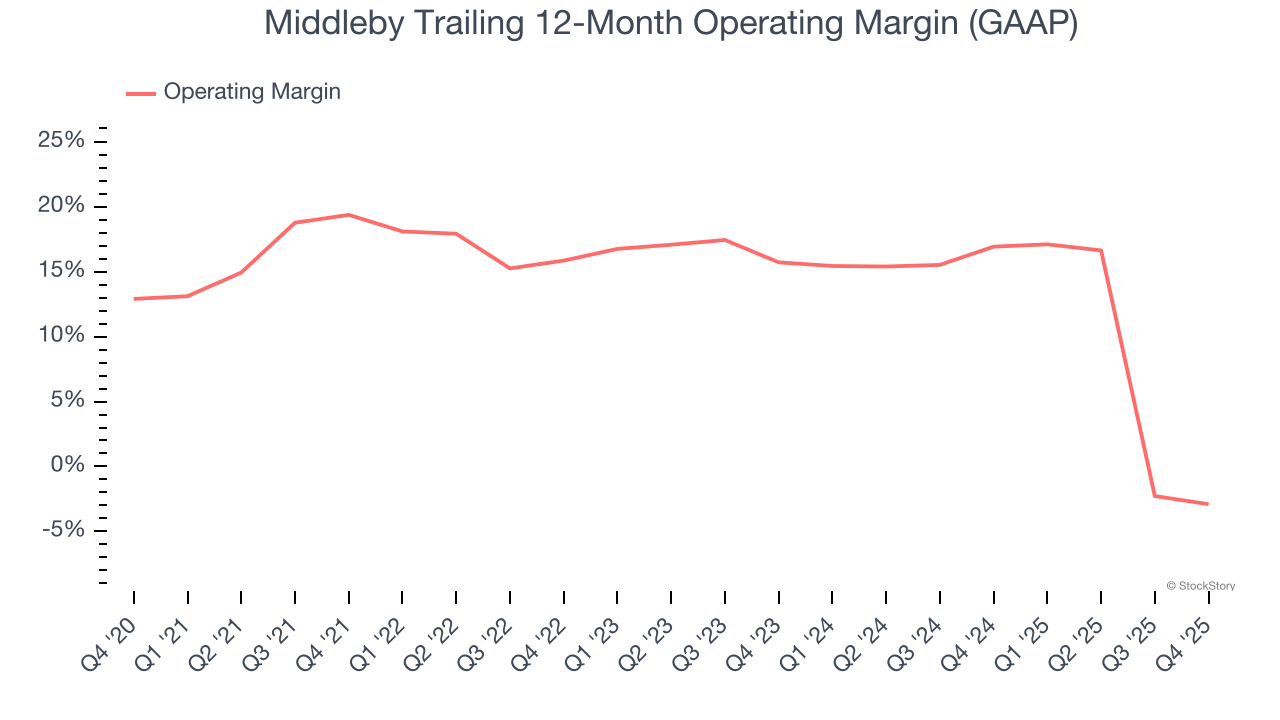
This quarter, Middleby generated an operating margin profit margin of 17.3%, in line with the same quarter last year. This indicates the company’s cost structure has recently been stable.
Earnings Per Share
We track the long-term change in earnings per share (EPS) for the same reason as long-term revenue growth. Compared to revenue, however, EPS highlights whether a company’s growth is profitable.
Middleby’s EPS grew at a remarkable 13.2% compounded annual growth rate over the last five years, higher than its 8.2% annualized revenue growth. This tells us the company became more profitable on a per-share basis as it expanded.
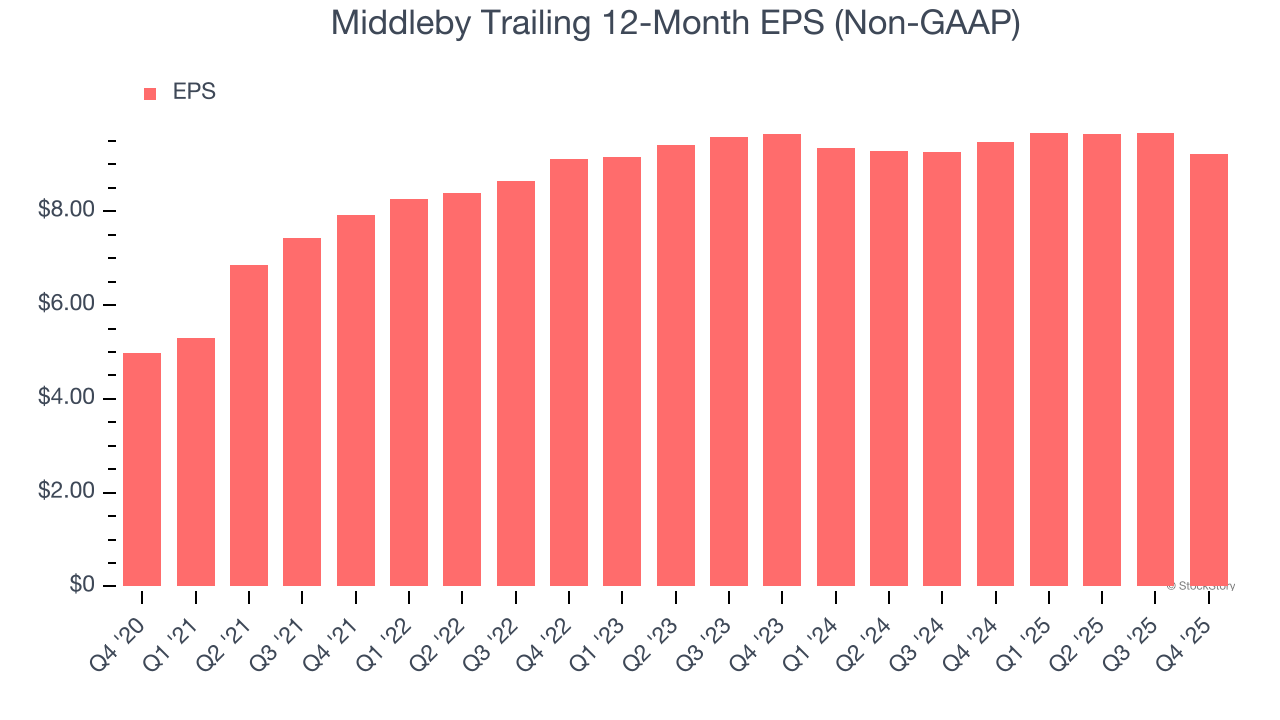
We can take a deeper look into Middleby’s earnings quality to better understand the drivers of its performance. A five-year view shows that Middleby has repurchased its stock, shrinking its share count by 9.2%. This tells us its EPS outperformed its revenue not because of increased operational efficiency but financial engineering, as buybacks boost per share earnings. 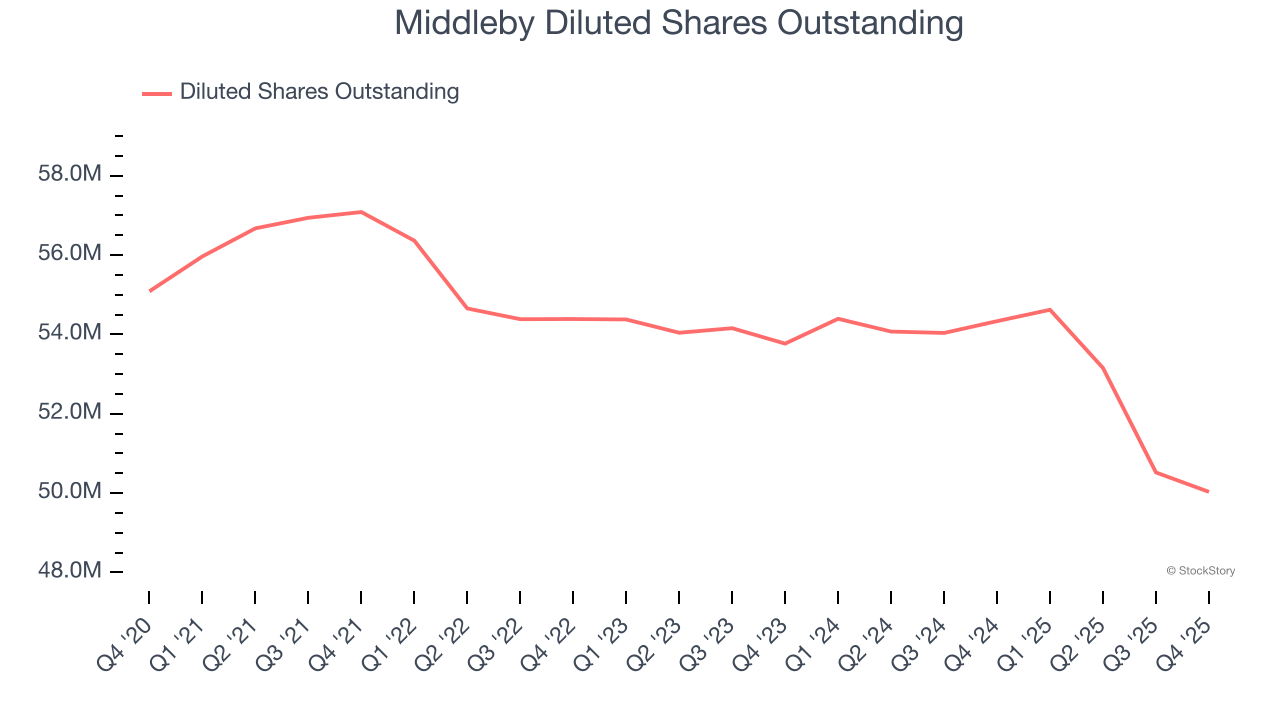
Like with revenue, we analyze EPS over a shorter period to see if we are missing a change in the business.
For Middleby, its two-year annual EPS declines of 2.3% mark a reversal from its (seemingly) healthy five-year trend. We hope Middleby can return to earnings growth in the future.
In Q4, Middleby reported adjusted EPS of $2.42, down from $2.88 in the same quarter last year. Despite falling year on year, this print beat analysts’ estimates by 7.2%. Over the next 12 months, Wall Street expects Middleby’s full-year EPS of $9.22 to grow 3.4%.
Key Takeaways from Middleby’s Q4 Results
We enjoyed seeing Middleby beat analysts’ EBITDA expectations this quarter. We were also glad its EPS outperformed Wall Street’s estimates. On the other hand, its full-year revenue guidance missed and its full-year EBITDA guidance fell short of Wall Street’s estimates. Overall, this was a softer quarter. The stock remained flat at $157.50 immediately following the results.
Middleby’s earnings report left more to be desired. Let’s look forward to see if this quarter has created an opportunity to buy the stock. If you’re making that decision, you should consider the bigger picture of valuation, business qualities, as well as the latest earnings. We cover that in our actionable full research report which you can read here (it’s free).


