What happens to hot momentum stocks when their rocket fuel runs out? How long can they continue to fly before they come crashing back down to earth? Why is the stock that you paid $100 a share for now trading at $39?
These are questions that many novice traders and investors may be struggling with in the wake of the most recent market correction. Momentum stocks have been hit hard as the Nasdaq 100 and Russell 2000 indices have moved lower in recent weeks. Caught unaware by the recent slide, some traders may be wondering when their beaten-down stocks will snap back and allow them to exit with smaller losses (or even reach the mythical "break even" point).
While growth stocks still firmly within their uptrends may form constructive technical bases and move higher after this correction, others may experience sharper pullbacks or break down into full "stage 4" declines (see chart below). Story stocks built on lighter foundations can have very quick momentum-fueled boom and bust cycles.
 |
| Stan Weinstein stage analysis chart. |
So what can you expect to see during a high-flying momentum stock's boom and bust cycle? We'll start with a prime example from the dot com bubble days: InfoSpace.
 |
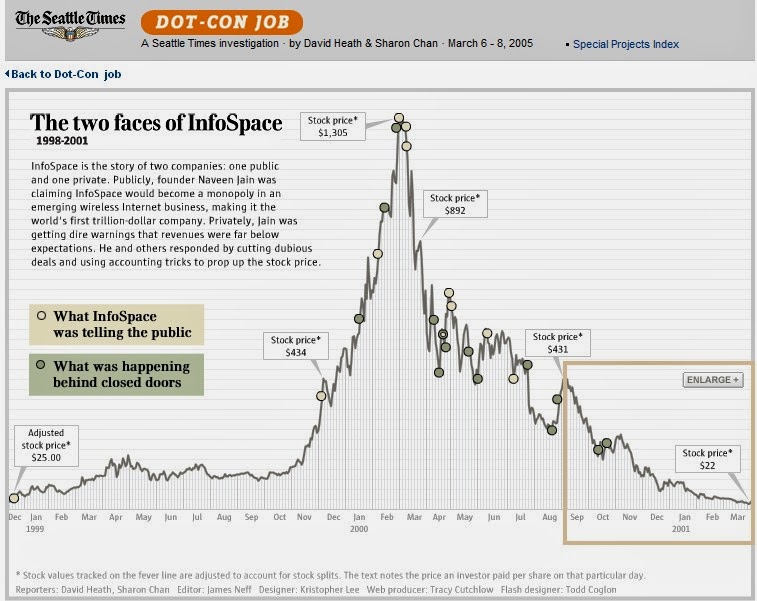
| InfoSpace boom and bust via Seattle Times. |
Here is a chart of former high-flyer, InfoSpace during its runaway advance in 1999-2000. You'll note that what went high soon topped and came down hard as the bubble burst in 2000-2001.
Anyone remember the stock's meteoric rise from under $100 to $1,300 a share? Well, the subsequent bust took the stock back down below its adjusted $25 base price. There were some bear rallies during the downtrend, but each snap back rally made successively lower highs. For hapless "buy and hope" speculators, there was no break-even point.
This is why, as a trader or self-directed investor, you need to manage your risk. When an uptrend eventually fizzles and tops out, the downtrend always follows. We don't know how far the decline will go, but it's best not to stick around and find out. No tree grows to the sky and no stock goes up forever, especially those story stocks for which real earnings growth and sound fundamentals are lacking. So take profits or cut your losses before they become unmanageable.
Here are a few more recent charts of momentum stocks in the tech and cannabis industries. I've annotated these to highlight the magnificent rises and quick declines you can expect to find with "round-trip" momo stocks.
1). CANV - Cannabis stock which participated in the "green rush" of early 2014. The hot trend surrounding marijuana legalization has fueled big moves in some OTC weed stocks. CANV rose from $30 to $180 in just 2 months. Just as quickly as it rose, it has fallen back below the $30 level in recent days.

2). UNXL - From $6.50 to $40 in 6 months. A year-long decline has taken the stock back down to $7. It will likely decline back to, and below, its prior $5 - $6 base.

3). BVSN - Rising out of its base, BVSN had a 500% rise fueled by a "pump and dump" stock promo scheme. The price bars became increasingly large and volatile as the stock topped out and subsequently declined below the $30 level. A new base has formed, completing the cycle.

Note: Thanks to Olivier Tischendorf for recently discussing round-trip momentum stocks and sharing charts with me. His insights helped influence this post. Check out his website and Twitter for more on trading high potential stocks.