Still negative. This is just a composite of other indexes that have been released:
Chicago Fed National Activity Index
Highlights
October was a soft month for the economy but solidly improved from September, based on the national activity index which is at minus 0.04 vs September’s revised minus 0.29. October’s improvement is centered in the key component of employment, at plus 0.11 vs September’s minus 0.06. The gain reflects the month’s very strong 271,000 rise in nonfarm payrolls and the 1 tenth downtick in the unemployment rate to 5.0 percent.
Turning to the three other components, manufacturing was also a plus for October, from minus 0.17 in September to minus 0.05 and reflecting the related component gain in the industrial production report. The sales/orders/inventories component was little changed, at minus 0.01, as was personal consumption & housing at minus 0.09.
The improvement in October, however, did not lift the 3-month average, at minus 0.20 vs a revised minus 0.03 in September in a reminder that the nation’s economic growth remains, by historical standards, sub-par.
I don’t give much weight to the Markit reports as they have tended to overstate things, which makes this one somewhat interesting:
PMI Manufacturing Index Flash
Highlights
Markit’s U.S. manufacturing sample is finally reporting weakness, weakness long registered across the breadth of other manufacturing data. The manufacturing PMI, at 52.6 for the November flash, is still above 50 to indicate monthly growth but the rate of growth is the slowest for this sample in more than two years, since October 2013. Growth in new orders is also the slowest in just over two years with respondents citing special weakness in exports which, hit by the strong dollar and weak global demand, dipped back into the contraction column in the month. Markit’s sample still, however, reports a “robust” rate of production which is a positive indication for November industrial production.
Other readings include the first drop in a year for backlog orders and a fourth straight dip for finished goods inventories. Price data show contraction for inputs, one tied to lower transportation and commodity prices, and little change for finished goods prices. A sign of strength comes from another gain for employment, again in contrast to other data.
More evidence of a slowing housing market for all the reasons previously discussed:
Existing Home Sales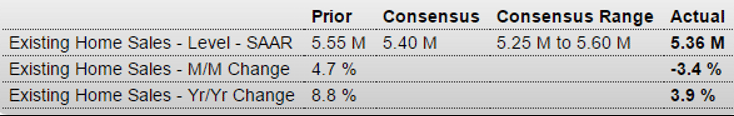
Highlights
Sales of existing homes are not a source of strength for the economy, down 3.4 percent in October to a slightly lower-than-expected annualized rate of 5.36 million. Year-on-year, sales are up only 3.9 percent which is the lowest for this reading since January. Weakness is split roughly even between single-family homes, down 3.7 percent in the month to a 4.75 million rate, and condos, down 1.6 percent to a 610,000 rate.
Lack of homes on the market, in a reflection of price weakness, remains a major factor holding down sales. Supply relative to sales is at 4.8 months, up slightly from the prior month but still below the 5.2 months of October last year. A reading of 6.0 months is considered a balanced market. The number of homes on the market, at 2.14 million, is actually below the 2.24 million this time last year, an unwanted surprise that the National Association of Realtors, which compiles the existing home sales report, calls “disturbing”.
Price data for October are once again weak, down 0.9 percent for both the median (at $219,600) and the average (at $262,800). Year-on-year, the median is up 5.8 percent with the average up 3.4 percent.
Regional sales data show a sharp decline in the West, down 8.7 percent in the month for a year-on-year gain of 2.7 percent. The South, which is the largest housing region, also shows weakness, down 3.2 percent for only a 0.5 percent year-on-year gain. The Northeast and Midwest were little changed in October with year-on-year appreciation very solid for both, in the high single digits.
But the weakness in the West and the weakness in the South are not positive indications for the housing sector where moderate strength on the new home side of the market is being offset by weakness on the existing side.
Familiar theme of deceleration after oil capital expenditures collapsed about a year ago: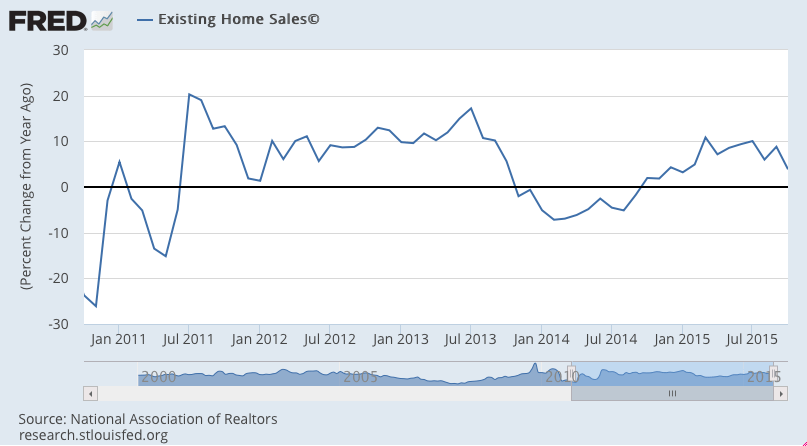
Saudis in the news but doesn’t look like they’ve changed the pricing policy that brought prices down, as they work to let prices fall to the point they sell their entire output capacity, like all the rest do:
Oil gyrates after Saudi Arabia reiterates support for market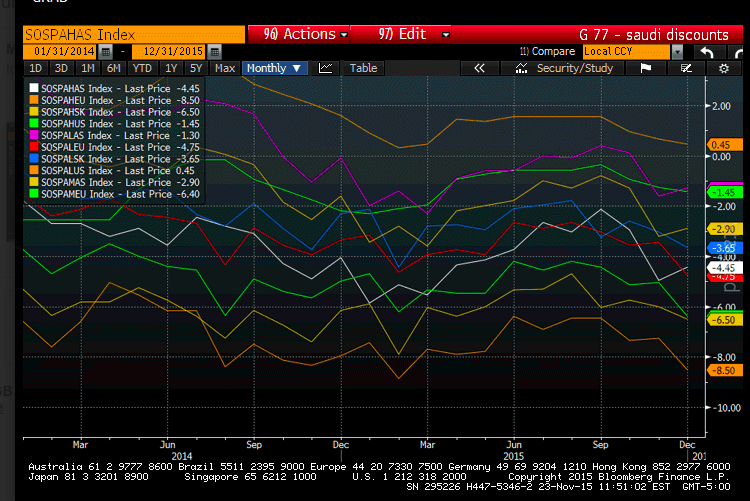
And it looks from this chart like spot prices remained subdued even during the days futures rose last week, and futures due ultimately converge to spot:
The post Chicago index, PMI manufacturing index, Existing home sales, Saudi pricing appeared first on The Center of the Universe.
