Hangzhou, China-based internet retail giant Alibaba Group Holding Limited (BABA) recently launched an Artificial Intelligence (AI) tool, Tongyi Wanxiang, which generates images from prompts. This generative AI offering could bolster the company’s prospects.
On the other hand, BABA is treading carefully in releasing such products in light of China’s regulatory crackdown on tech companies. Last Friday, Chinese regulators issued a 7.12 billion yuan ($992 million) fine for BABA’s financial arm Ant Group. This raised hopes that the prolonged scrutiny of Ant Group is finally coming to an end.
Given this situation, let’s look at the trends of BABA’s key financial metrics to understand why this stock could be a sound portfolio addition now.
Analyzing Alibaba Group's Financial Performance and Market Trends (2020-2023)
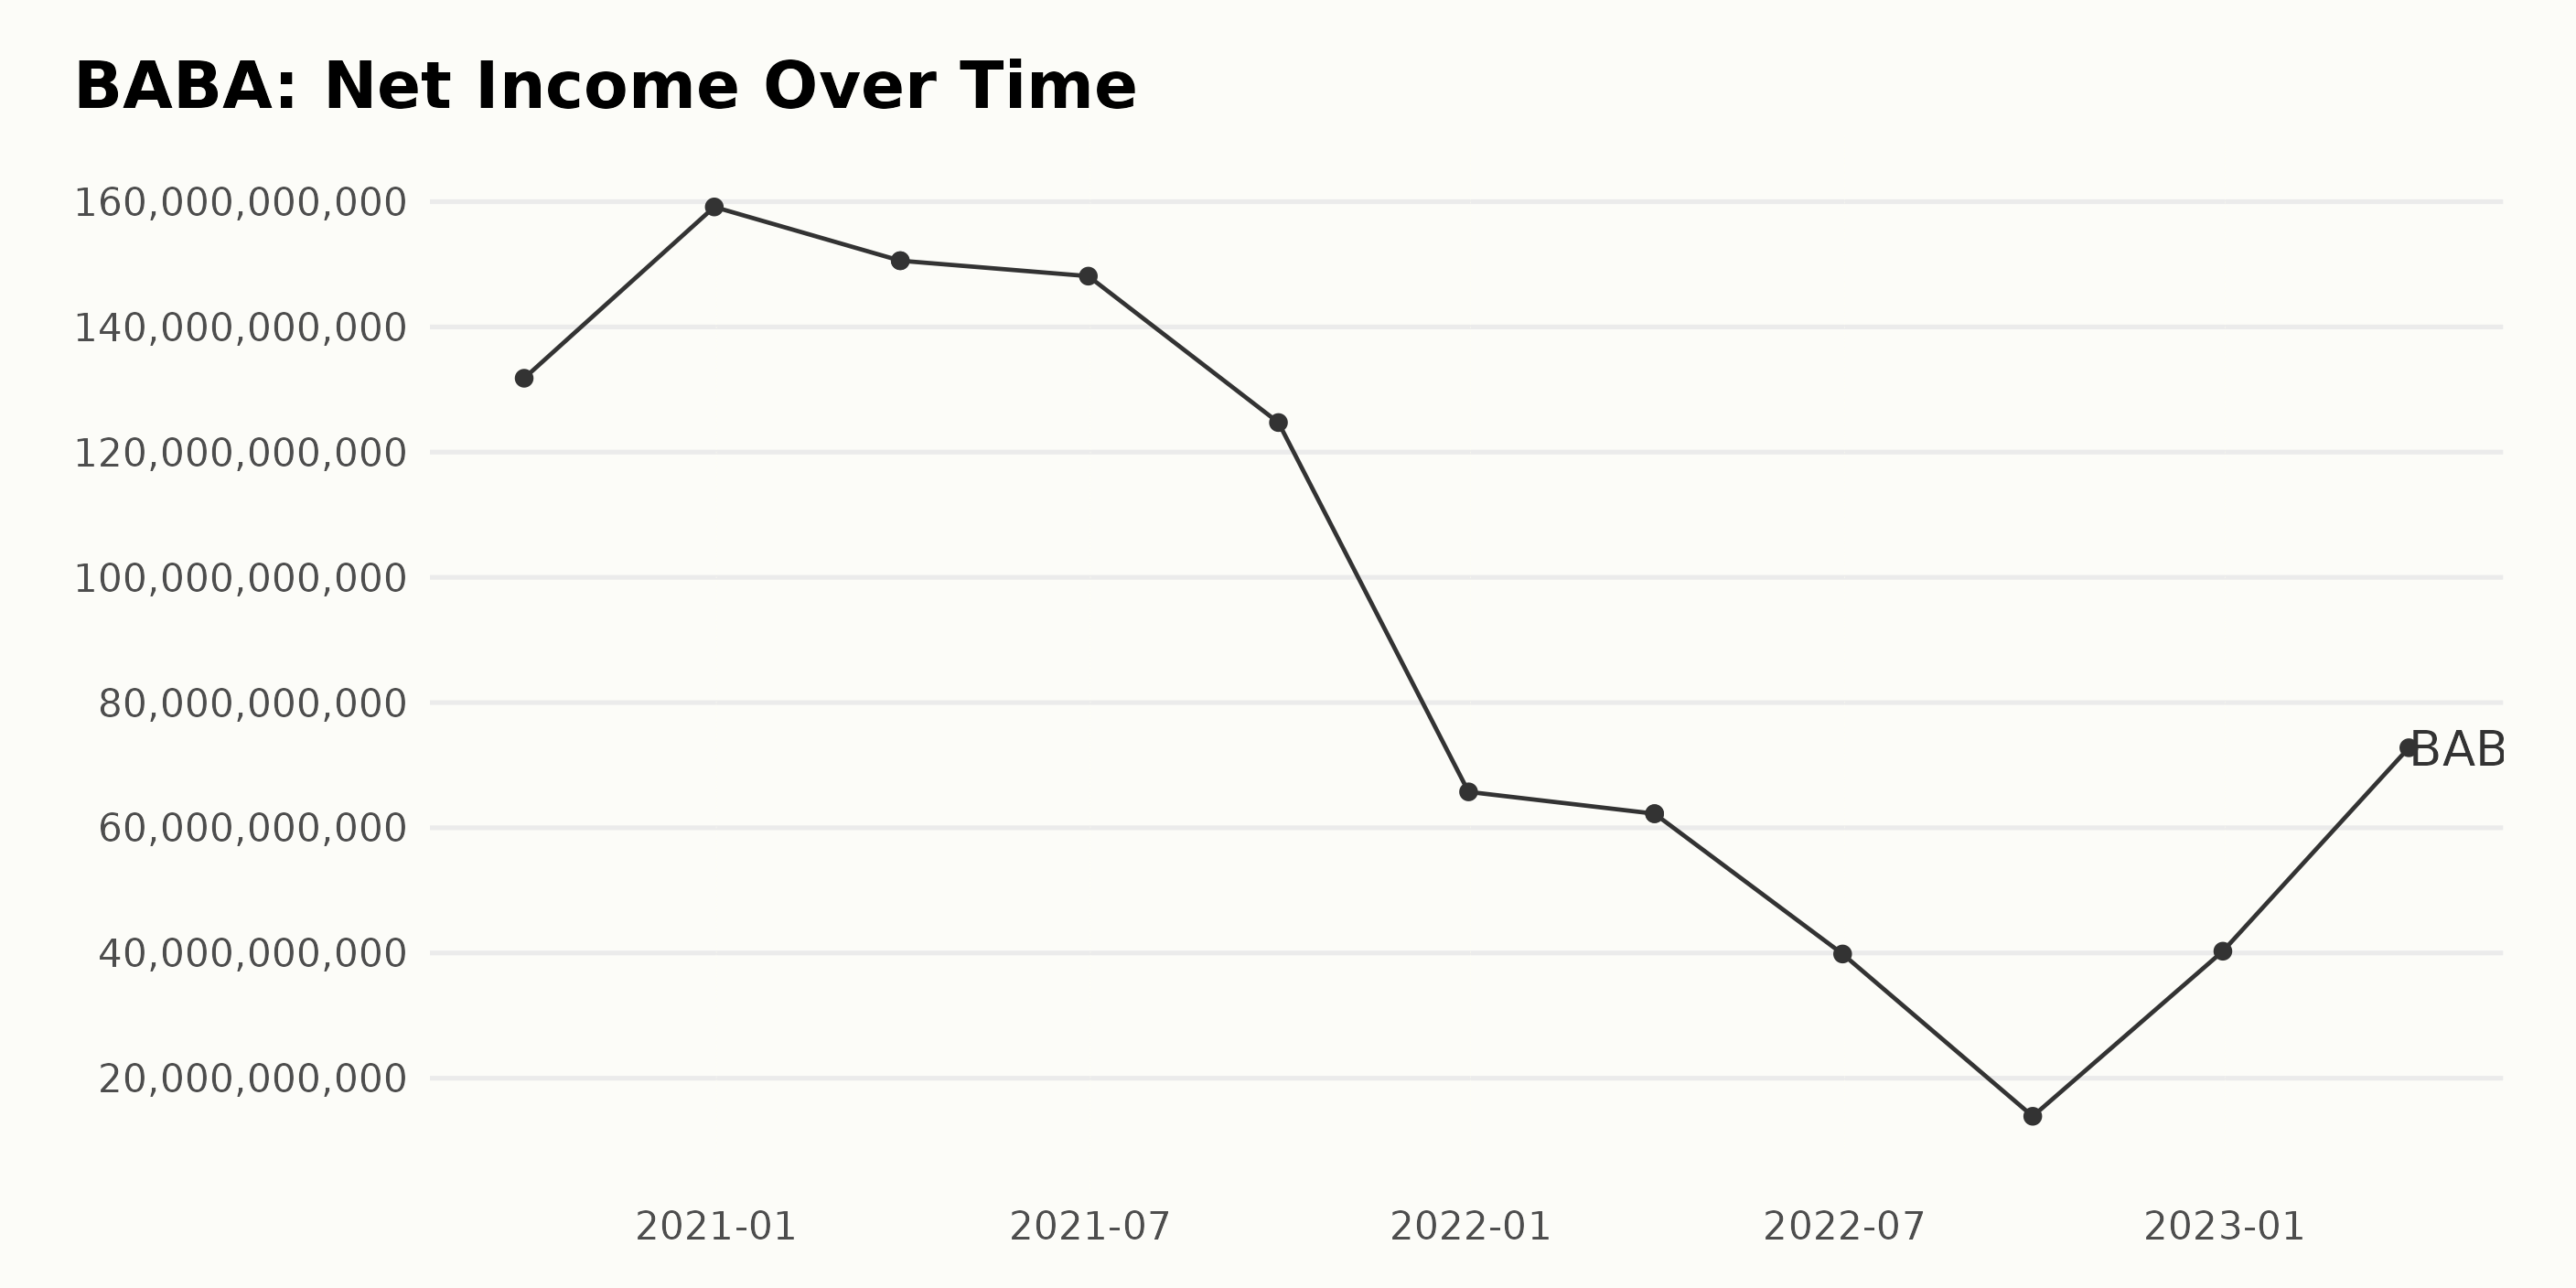
The data demonstrate the fluctuations and trends of the trailing-12-month net income for BABA.
- Starting with a net income of $131.8 billion on September 30, 2020, there is a rising trend that peaks at $159.16 billion by the end of the calendar year 2020.
- However, from the start of 2021, BABA experienced a consecutive decline in net income from $150.58 billion in March 2021 to $124.72 billion by September 2021.
- This downward trajectory continued into 2022, with net income falling steeply every quarter, reaching a low of $13.91 billion by September 2022.
- Despite this decline, BABA rebounded in the last quarter of 2022, rising to $40.28 billion by the end of December 2022.
- This regrowth continues into the first quarter of 2023, the last data point available, with an increased net income of $72.78 billion.
Net income has experienced a significant overall decline of approximately -44.76% (from an initial $131.8 billion in September 2020 to $72.78 billion by March 2023). The recent increase suggests some recovery, although the growth rate remains negative compared to the series' starting point.
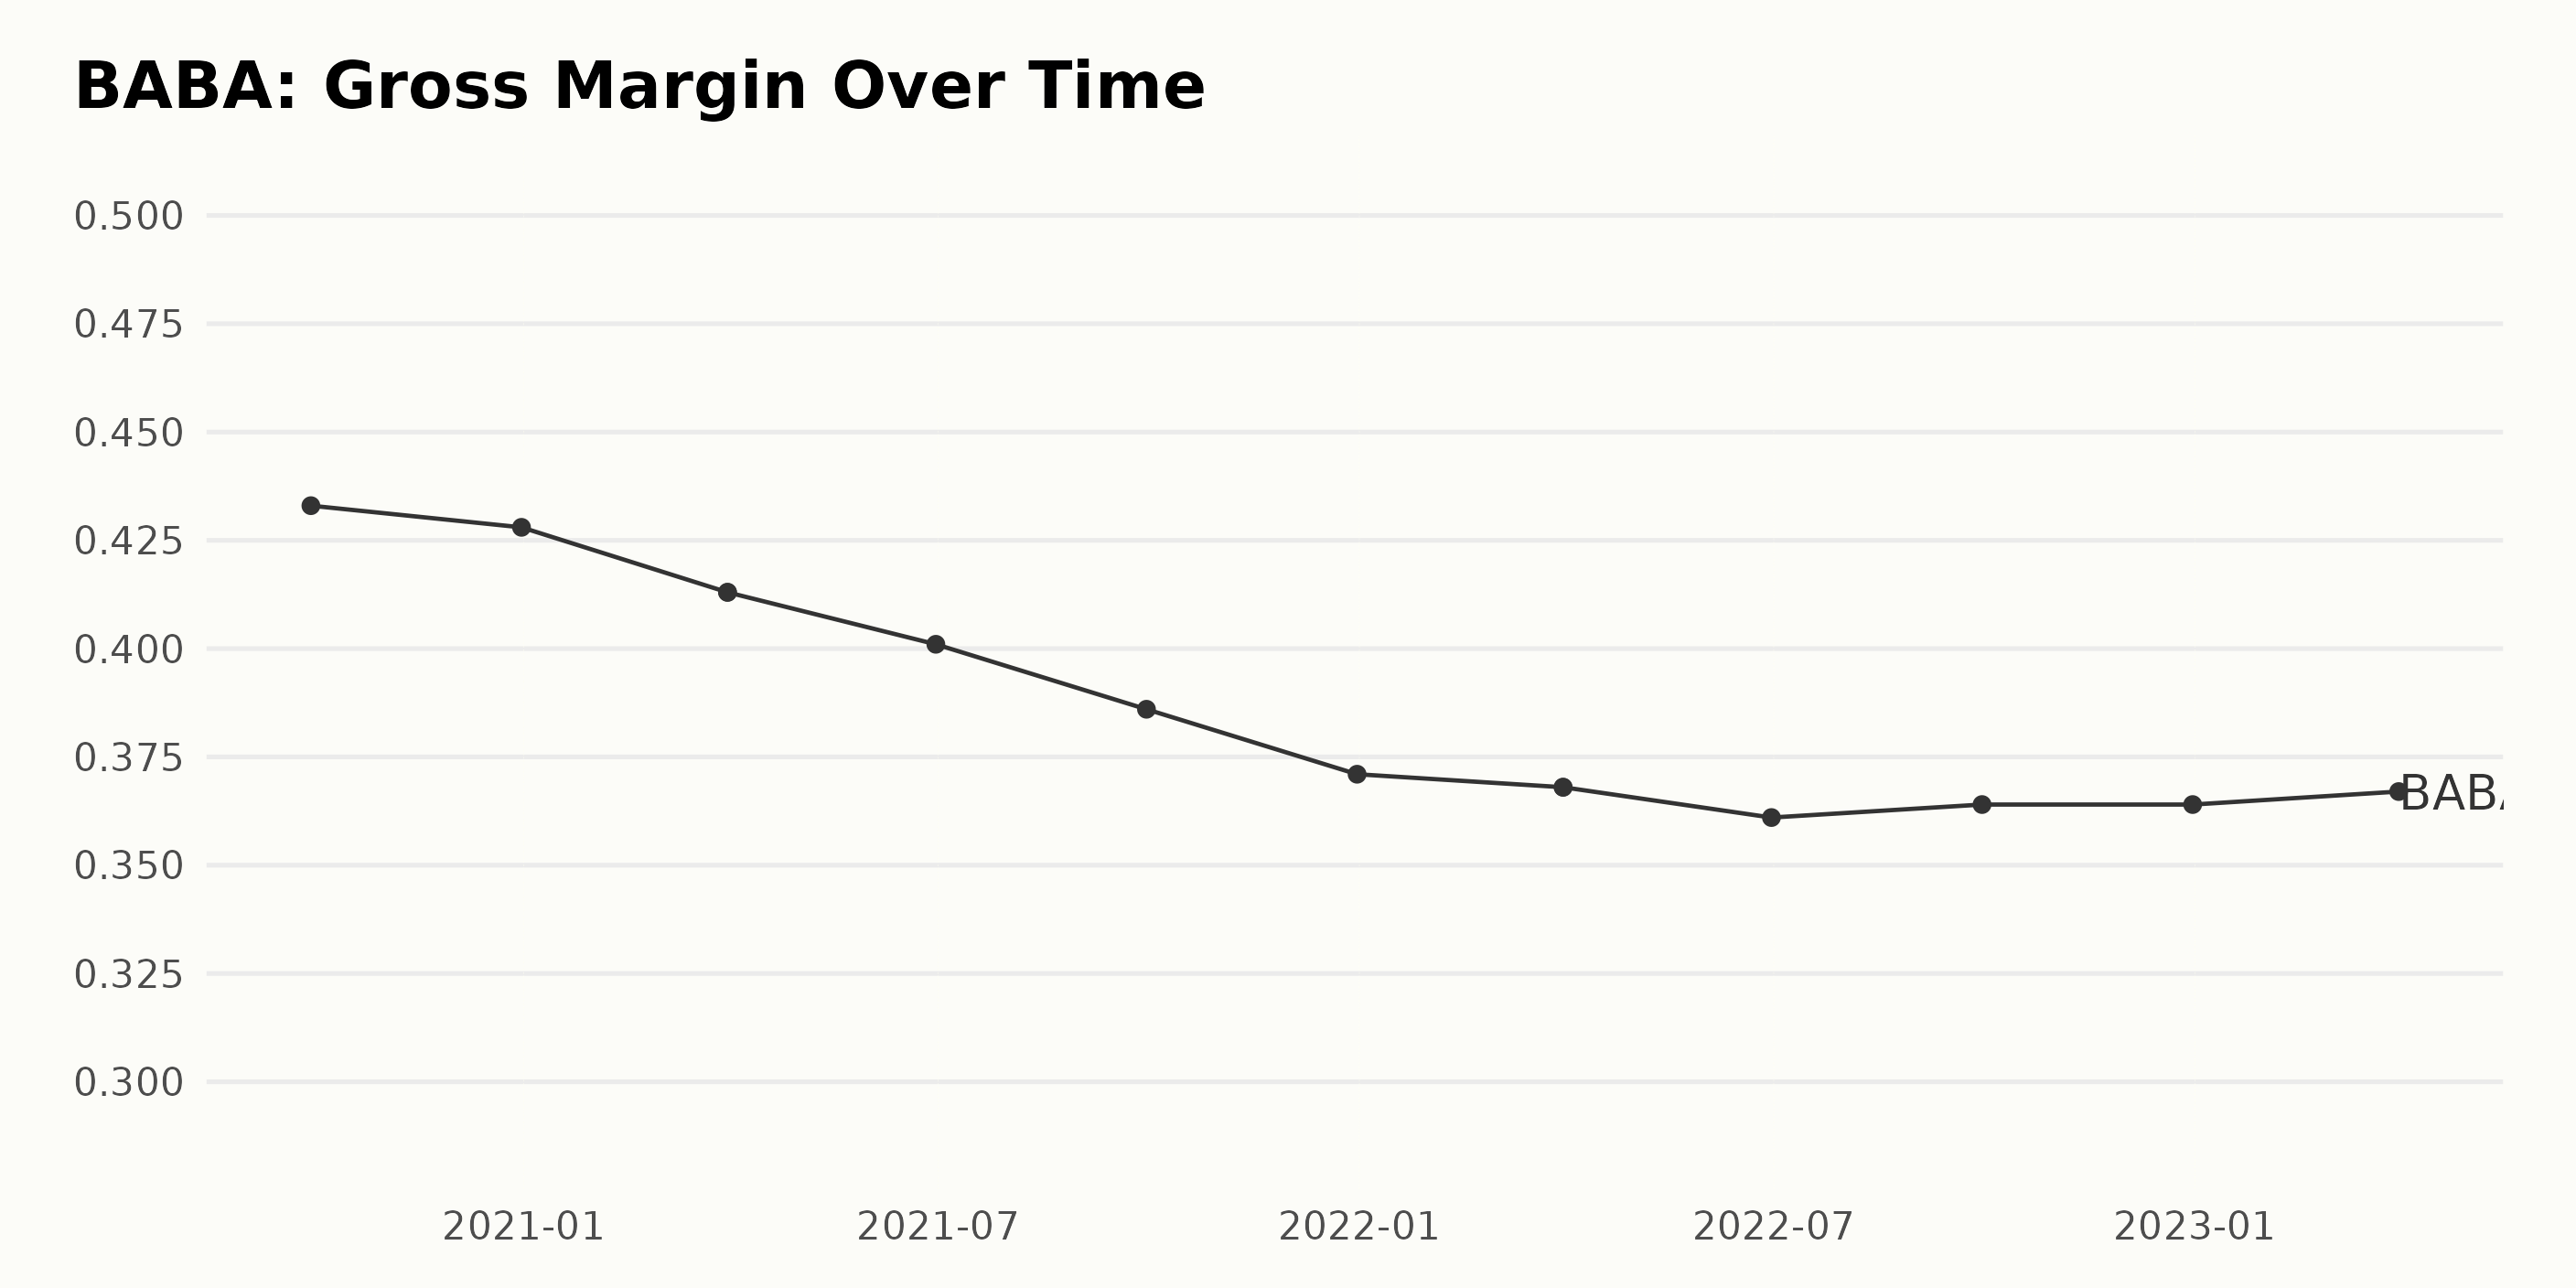
The gross margin of BABA has experienced a general downward trend from September 2020 to March 2023. Here are the key data points:
- September 2020: The gross margin was initially at 43.3%
- December 2020: It slightly went down to 42.8%
- March 2021: A noted decline can be seen, bringing it further down to 41.3%
- June 2021: Continued to decrease to 40.1%
- September 2021: Registering another decline to 38.6%
- December 2021: Went down again to 37.1%
- March 2022: Dropped yet again to 36.8%
- June 2022: Further dropped to 36.1%
- September 2022: Shows a slight increase to 36.4%
- December 2022: Maintained at 36.4%
- March 2023: Had a slight growth to 36.7%
Although there were two periods where the margins remained the same or increased slightly (from December 2022 to March 2023 and September 2022), the overall gross margin registered a decreasing trend of nearly 7%. The most recent data in March 2023 showed a slight recovery in the margin.
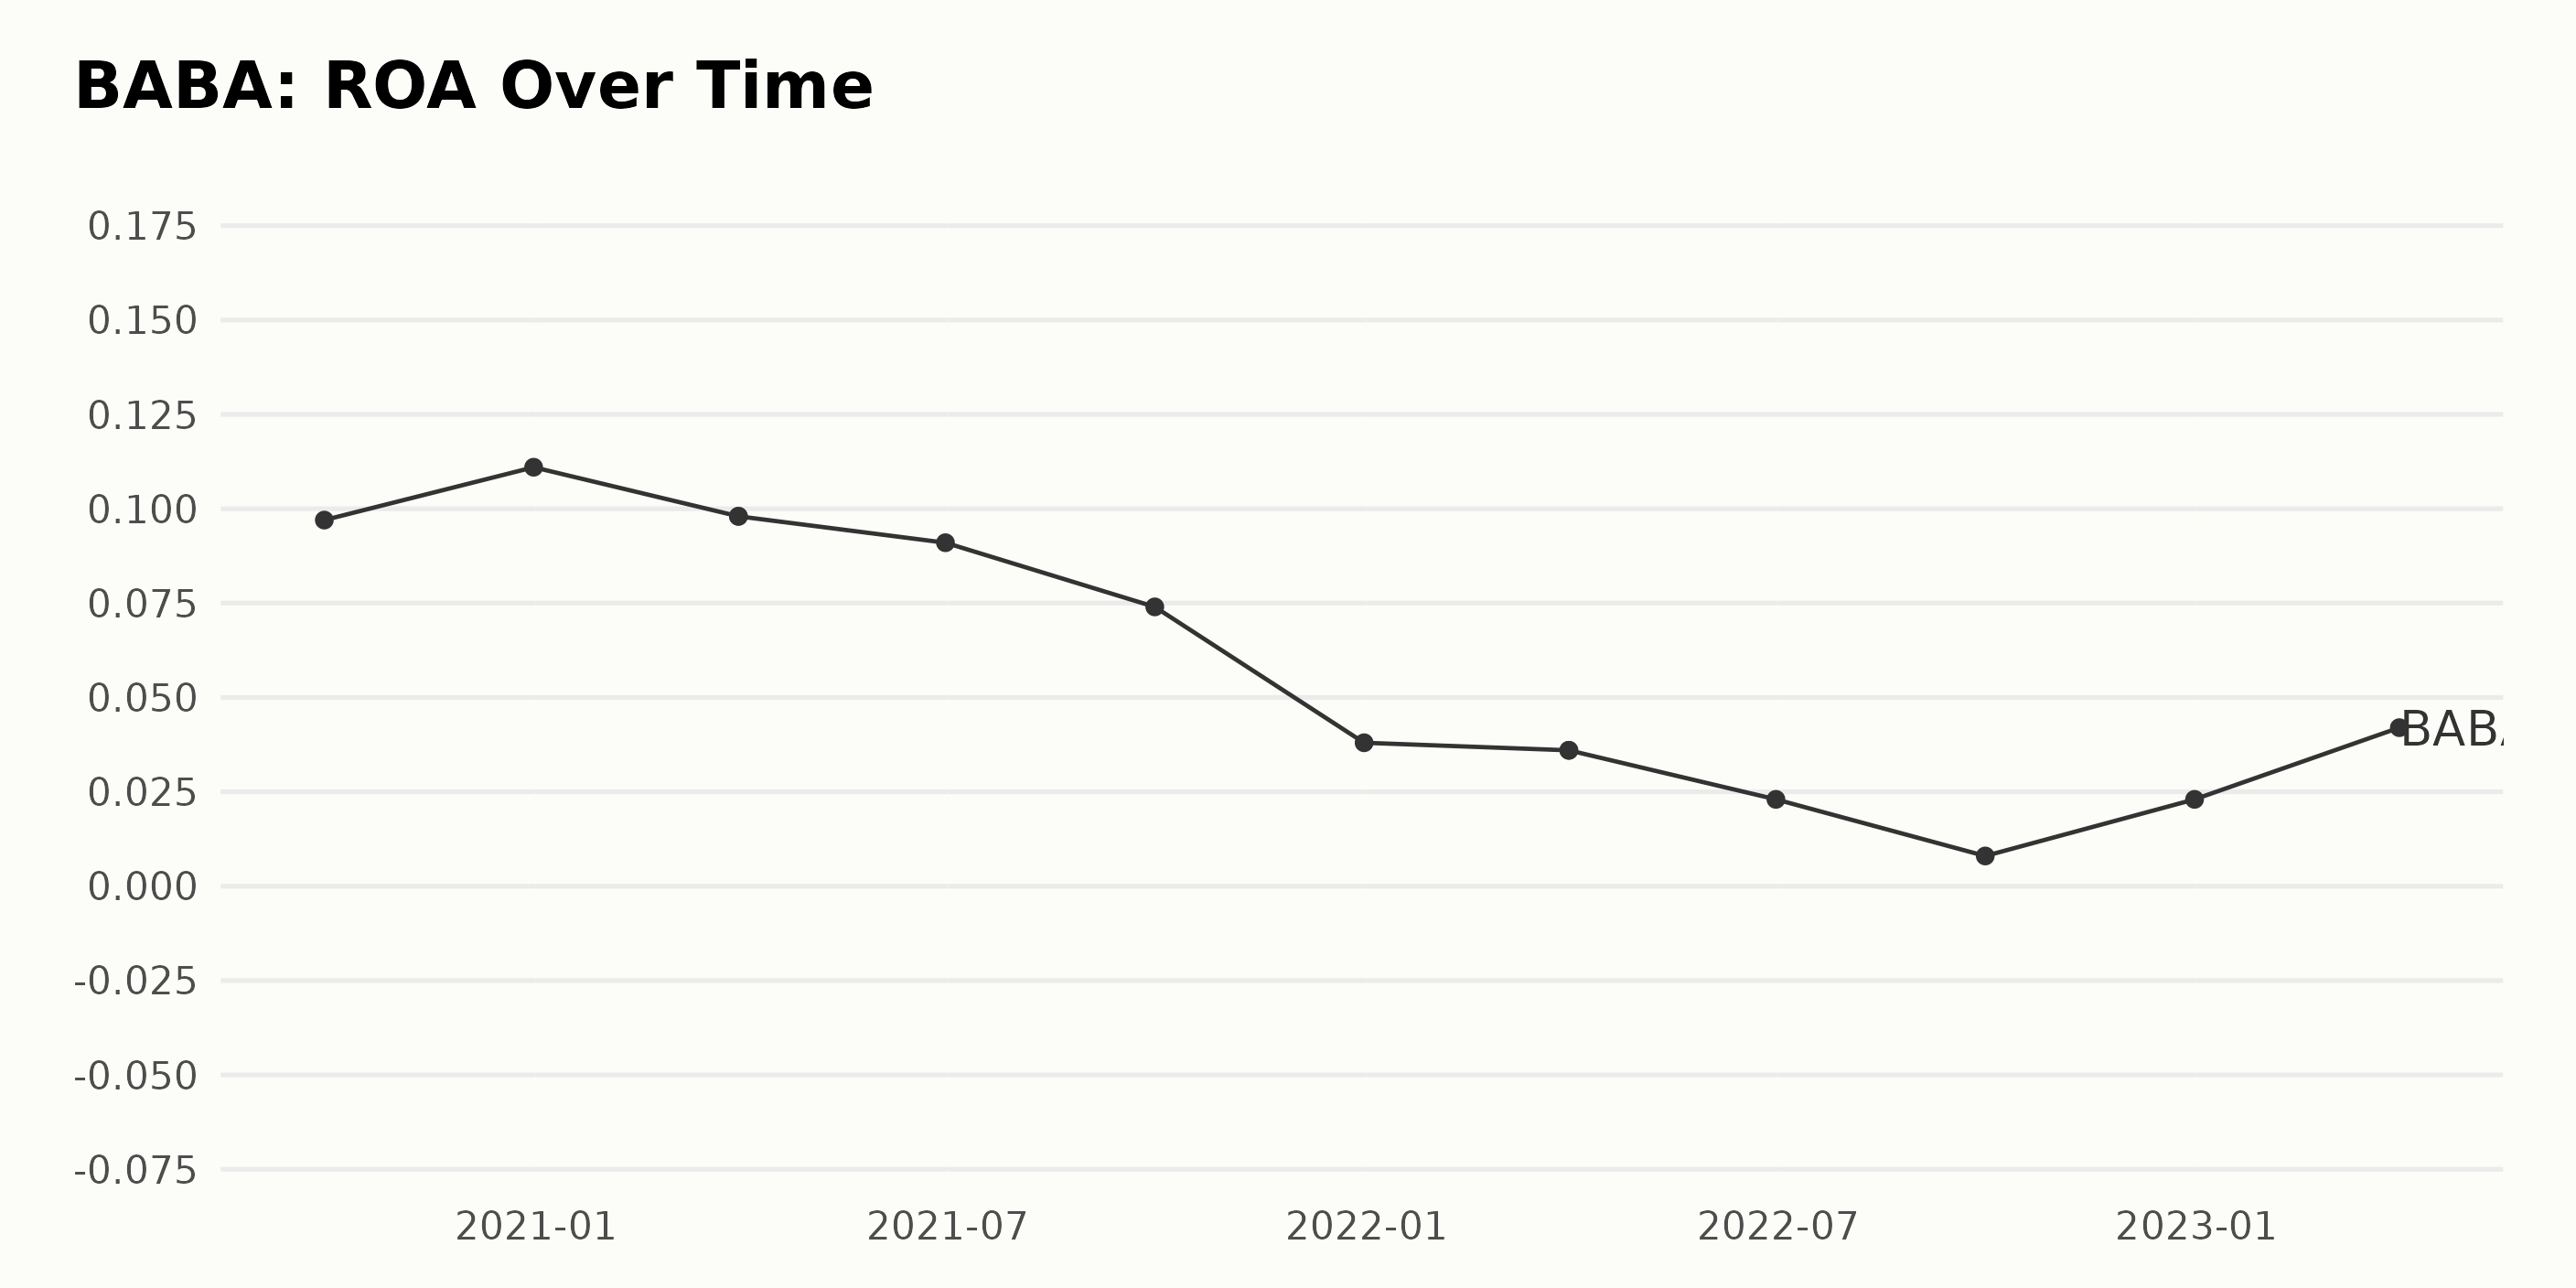
BABA's reported Return On Assets (ROA) presents a generally declining trend between September 2020 and September 2022, with some fluctuations observed.
- The ROA first increased from 0.097 in September 2020 to its peak of 0.111 by December 2020.
- However, it then began a series of declines, dropping to 0.098 by March 2021 and falling to 0.091 by June 2021.
- The sharpest decline was observed between June 2021 and September 2021; the ROA fell to 0.074. This downward trend was perpetuated until September 2022, when it reached 0.008.
- A notable resurgence was seen by December 2022, with the ROA rebounding to 0.023 before reaching 0.042 in March 2023, suggesting a possible revival.
Therefore, while the general trend indicates a decline over this period, more recent data from December 2022 indicates a potential turn-around toward growth. Calculating the overall growth rate from the first value in September 2020 (0.097) to the last value in March 2023 (0.042) reveals a growth rate of -56.70%.
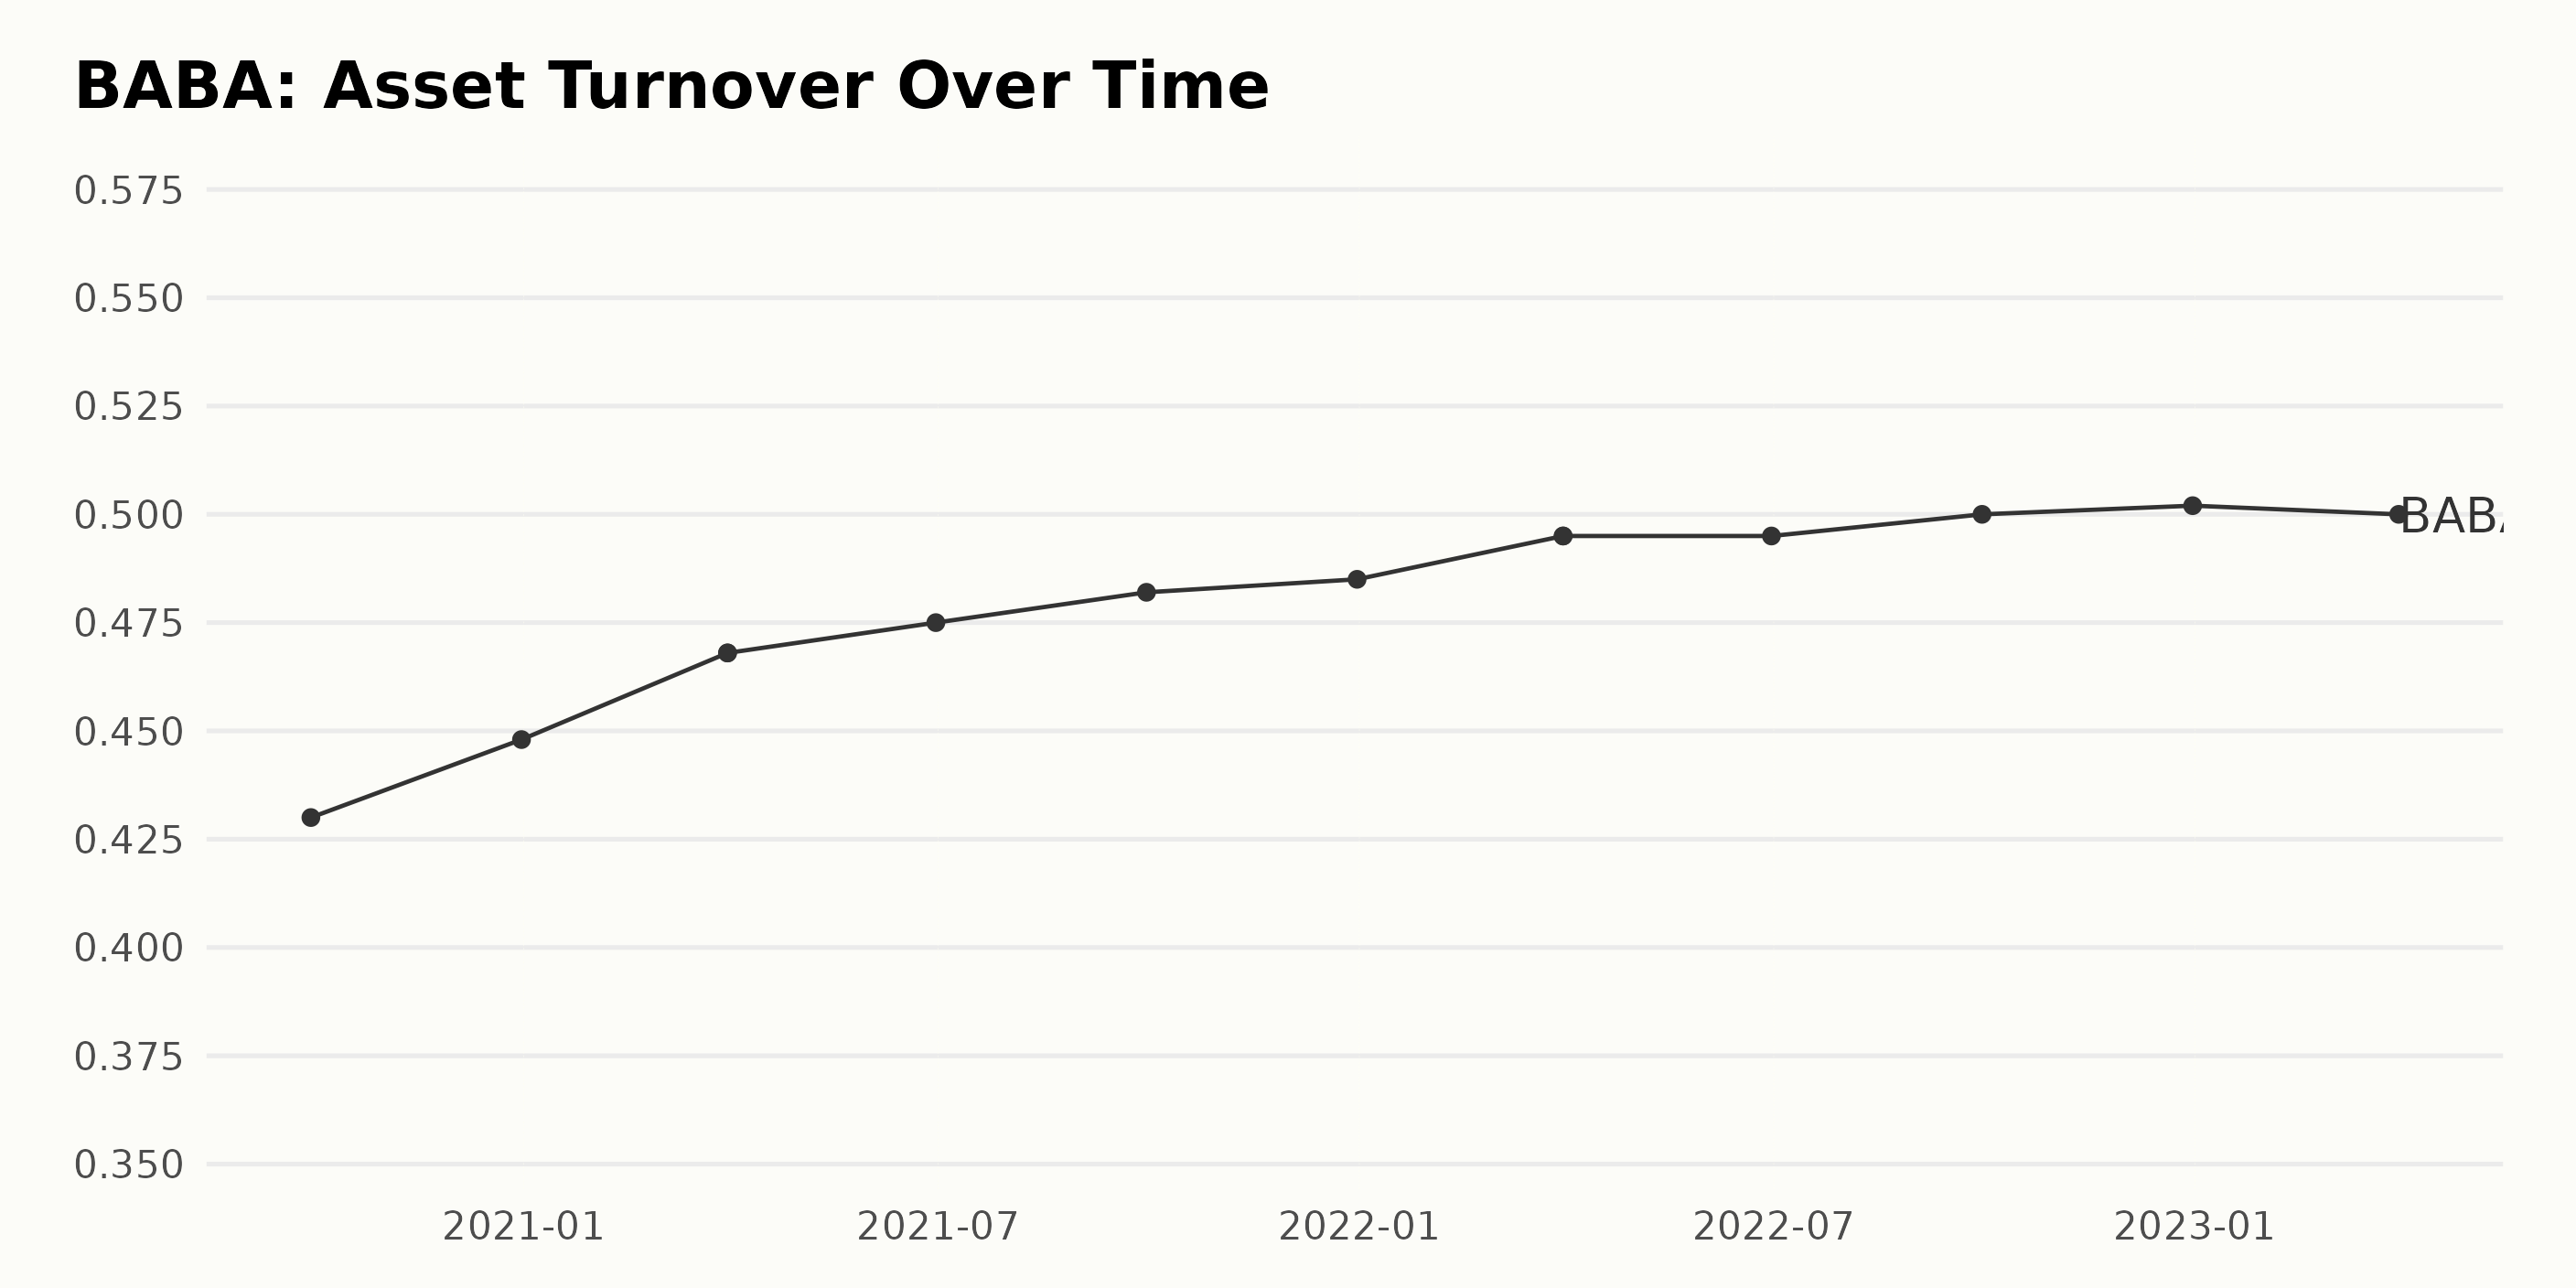
The asset turnover of BABA reflected a steady upward trend from September 2020 to December 2022, with some fluctuations. Here are the primary points:
- In September 2020, the asset turnover was at 0.43.
- There was a gradual growth in the numbers, with a notable increase in December 2020, reaching 0.45.
- Further, the asset turnover displayed a consistent upward movement reaching 0.47 by March 2021.
- The trend slightly increased by September 2021, with an asset turnover reaching 0.48.
- As of December 2022, the figure slightly improved to 0.50. However, between June 2022 and September 2022, there was zero growth recorded.
- The data remains stagnant at an asset turnover of 0.50. This may point to minimal sales effectiveness during this period.
Looking at the growth rate, from the first reported value of 0.43 in September 2020 to the last reported value of 0.50 in March 2023, there has been approximately a 16% increase over the period.
Though the growth has been consistent overall, it’s important to highlight that the data experienced fluctuations and a period of stagnation was noted in 2022. However, in general, BABA’s asset turnover indicates a slow but steady increase over time, signifying improving efficiency in using its assets to generate sales.
Alibaba Share Price: Analyzing the Predominantly Downward 2023 Trend with Periods of Resurgence
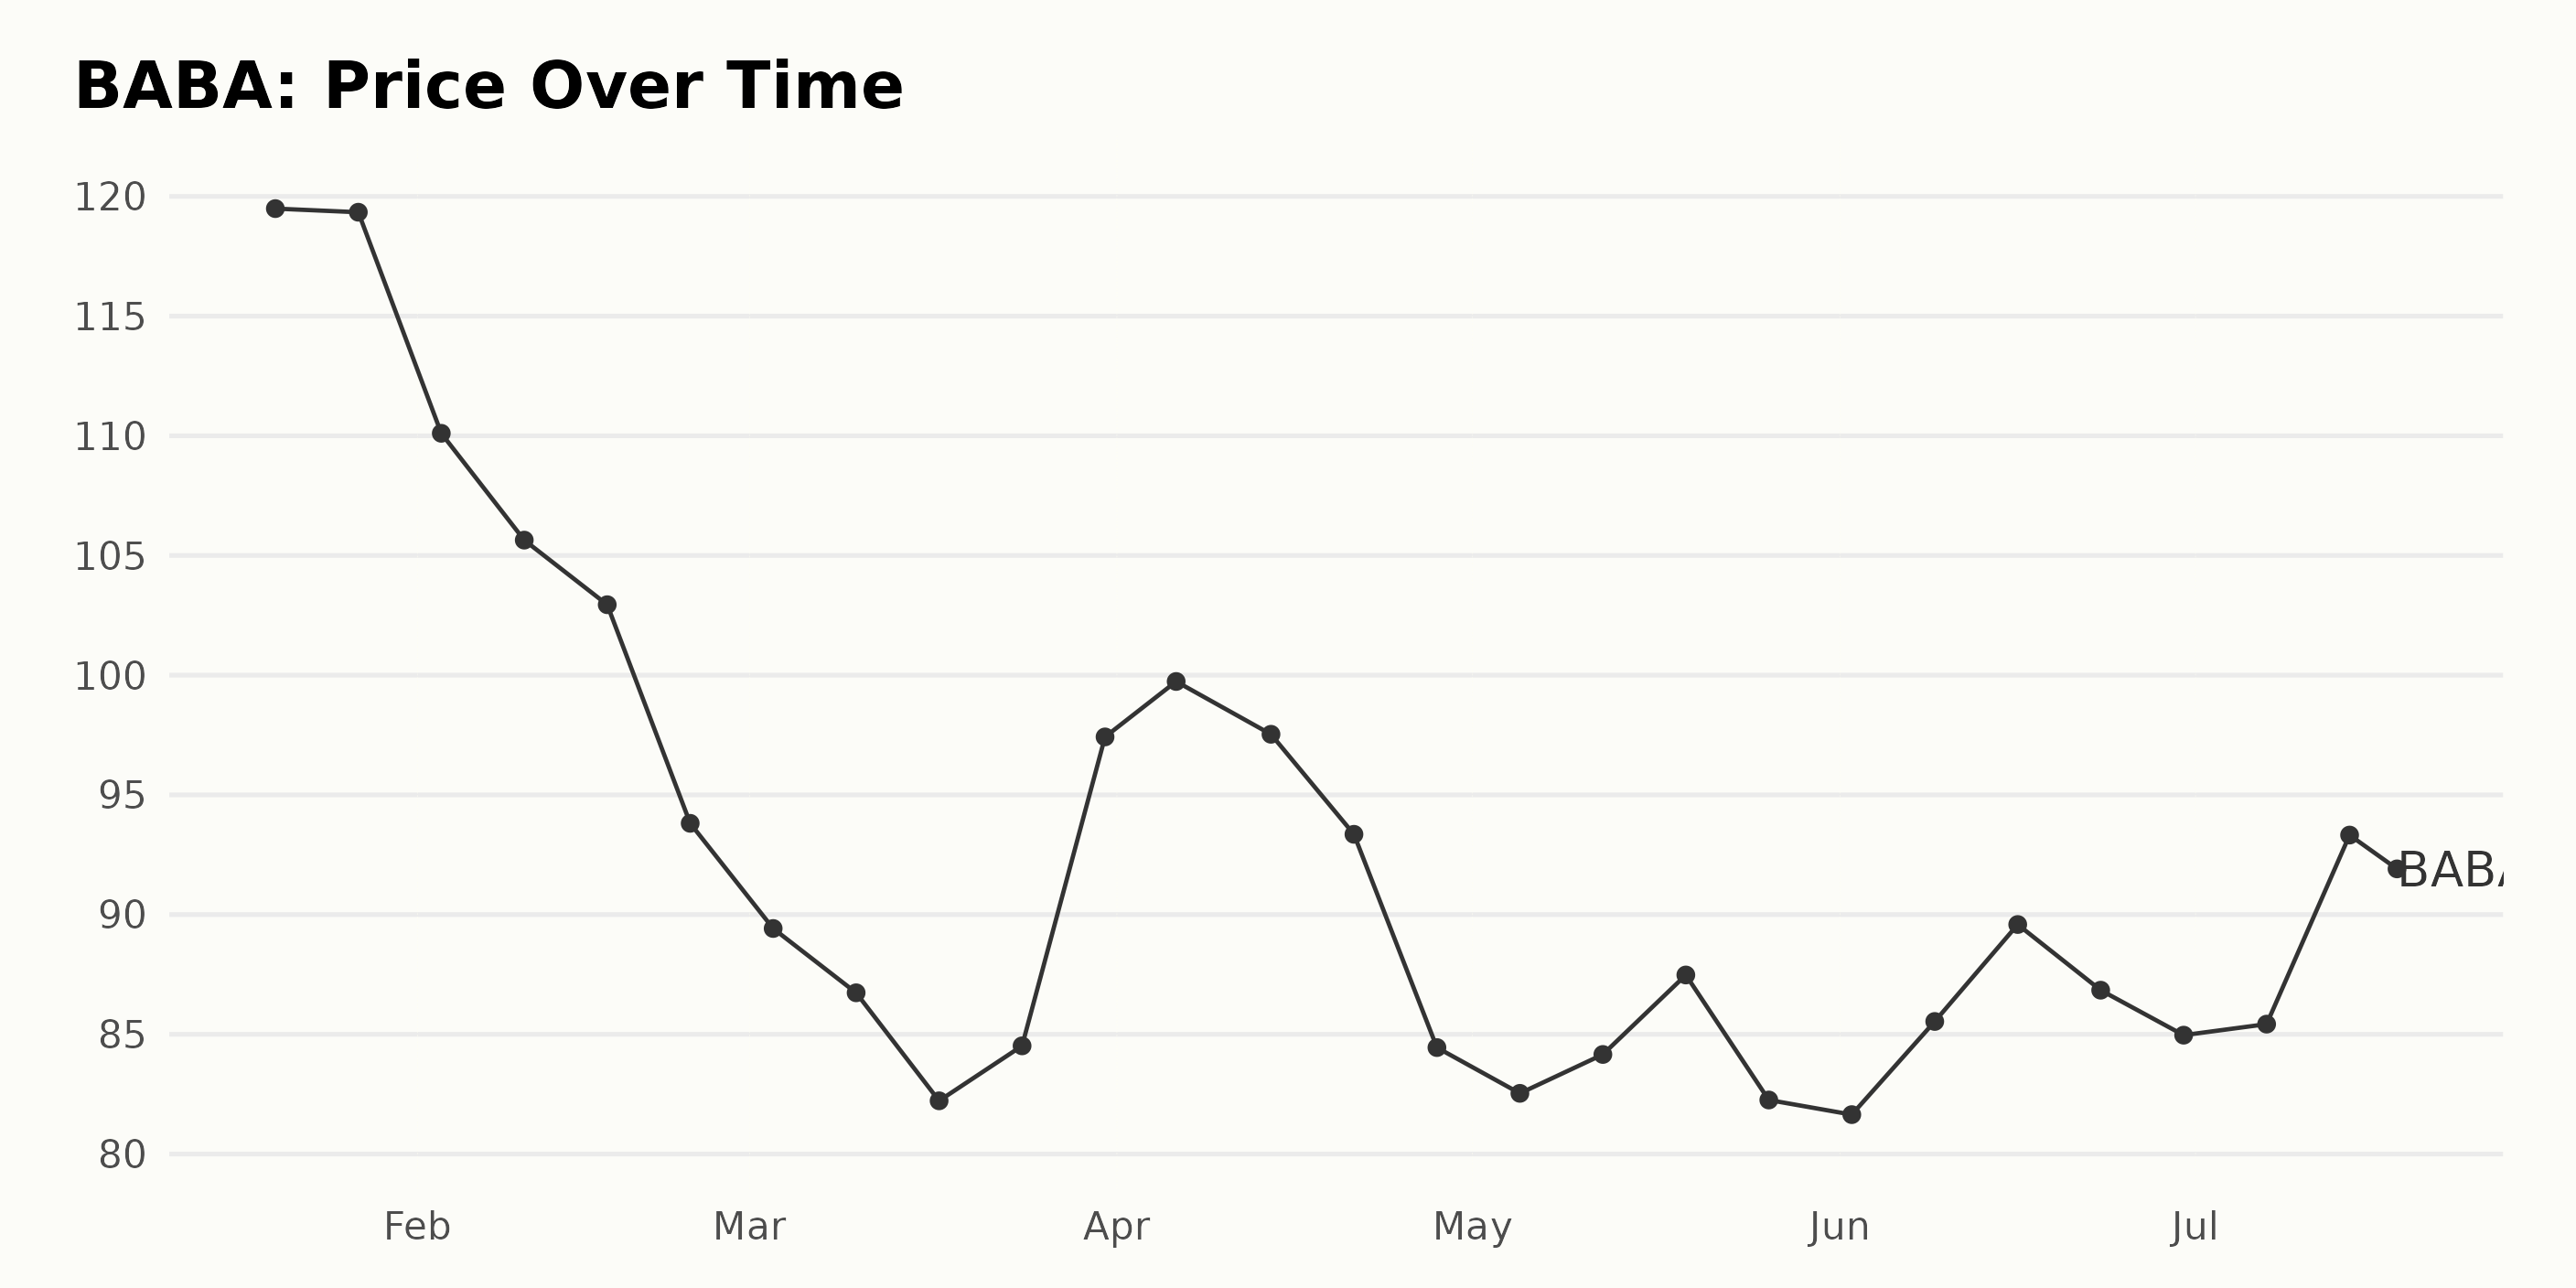
Based on the provided data, we can see some clear trends in the share price of BABA.
- From January 20, 2023 ($119.49), to February 24, 2023 ($93.81), a distinct downward trend indicates a strong depreciation.
- From February 24, 2023, to March 24, 2023, the prices decreased from $93.81 to $84.52, reinforcing the descending trend.
- However, this trend is momentarily interrupted when the share price increases to $99.74 on April 6, 2023, followed by fluctuations that lead to a retraced dip to $82.25 by May 26, 2023.
- From late May to mid-July 2023, the share price sees an upward spike, reaching back to $93.32 by July 14, 2023, implying a recovery phase before slightly dropping to $91.20 on July 18, 2023.
Overall, the first half of 2023 witnessed a predominantly decreasing trend in the share price of BABA. The rate of decline appeared to accelerate from January to February but decelerated a bit between March and May with minor ups and downs.
The latter part of the data from May until July indicates a somewhat recovery or an increasing trend in BABA's share price, but this upward movement is not as rapid as the initial decline. Here is a chart of BABA's price over the past 180 days.
Analyzing Alibaba's Performance: A Close Look at Quality, Growth, and Momentum
BABA has an overall POWR Ratings grade of B (Buy) as of July 19, 2023. This score reflects performance metrics such as Growth, Value, Momentum, and Stability. Some crucial points to note are,
BABA moved up to a B (Buy) grade on May 20, 2023, from a consistent C (Neutral) grade previously seen in 2023.
Despite fluctuating between B (Buy) and C (Neutral) grades between May and July 2023, it ended with a B (Buy) grade on July 18, 2023.
As for its rank within the China category of stocks, which consists of 45 total stocks, its last reported rank was #18. This improvement compared to earlier weeks indicates a better position amongst other China stocks during this period.
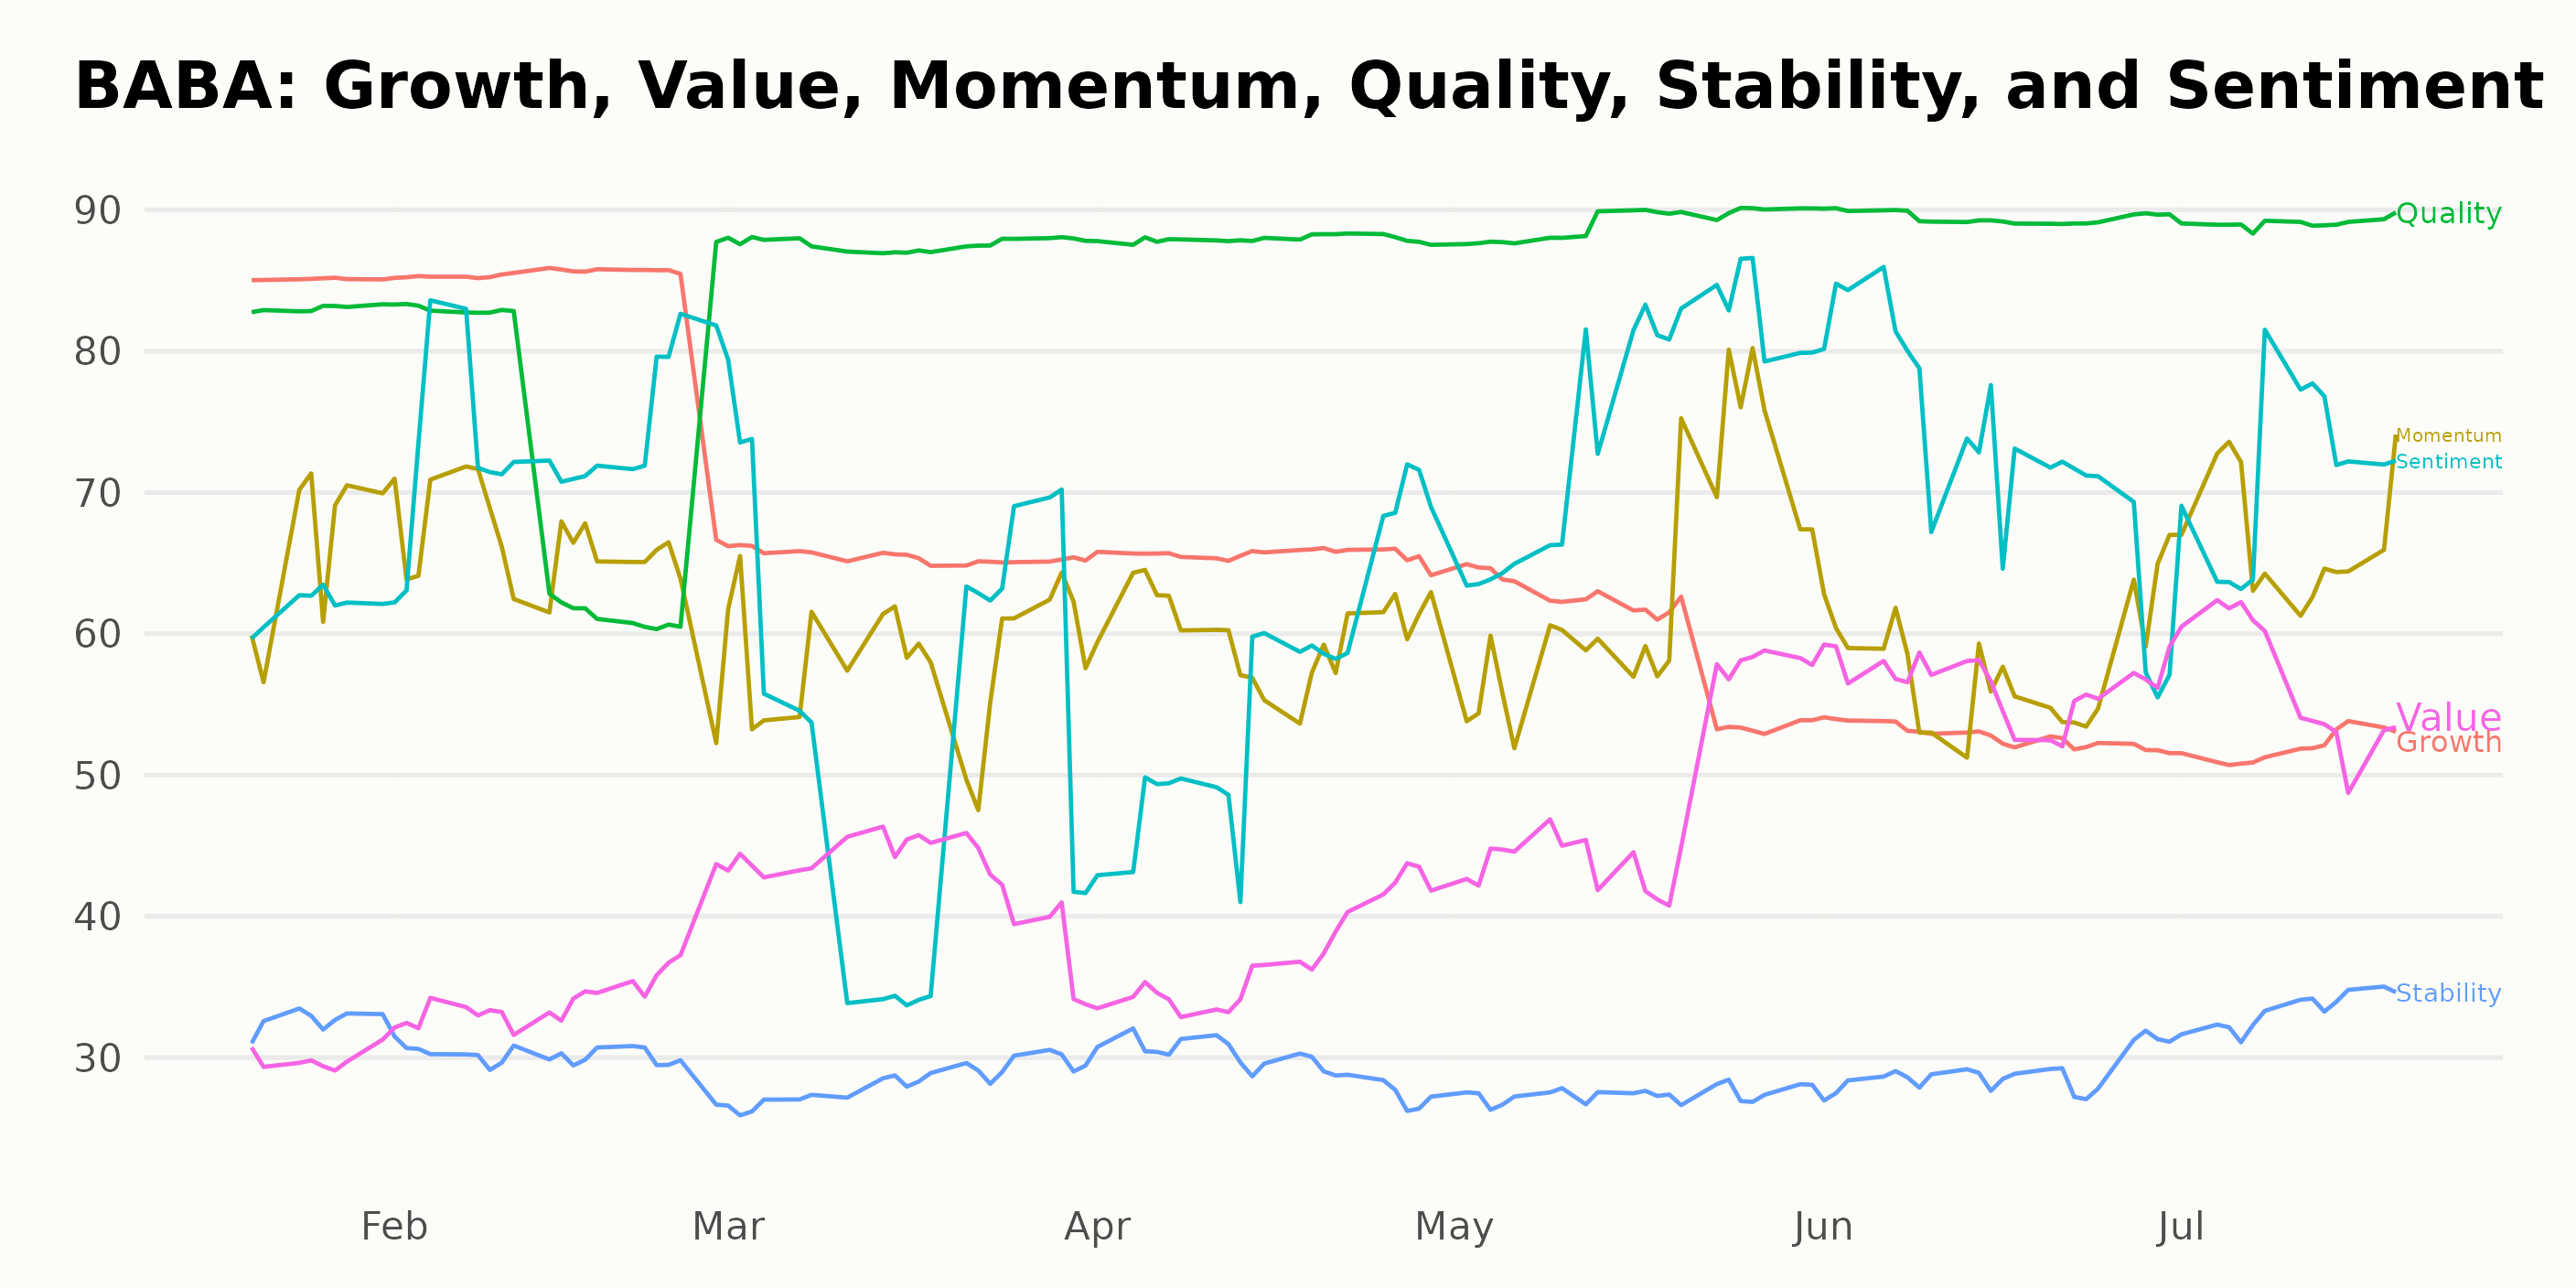
The POWR Ratings for BABA reveal some intriguing trends, focusing on the three most highly rated dimensions: Quality, Growth, and Momentum.
Quality: In January and February 2023, the quality scores were 83 and 72, respectively. A clear upward trend in the quality rating has been observed since March 2023, with a score of 88, and this remains consistent in April 2023. By May 2023, Quality increased marginally to 89, a score maintained through June and July 2023.
Growth: It started with a high rating of 85 in January and February 2023. However, from March to June 2023, there is a clear downward trend as the growth rating drops successively from 65, 66, and 60 to 53. The rating stabilizes slightly in July 2023 at 52 but is still significantly lower than its initial score.
Momentum: It started at 66 in January 2023 and maintained that rating in February 2023 as well. The ratings gradually decreased to 58 by March 2023 before seeing a slight uptick to 60 in April 2023. In May 2023, momentum increased to 64 and remained fairly stable across the next few months. It was 66 in July 2023.
The Quality dimension consistently garnered the highest ratings, making it a standout aspect of BABA. In contrast, there was a noticeable decline in the Growth ratings over the indexed period, while Momentum displayed a less drastic fluctuation.
How does Alibaba Group Holding Limited (BABA) Stack Up Against its Peers?
Other stocks in the China sector that may be worth considering are FinVolution Group (FINV), LexinFintech Holdings Ltd. (LX), and X Financial (XYF) - they have better POWR Ratings.
What To Do Next?
Get your hands on this special report with 3 low priced companies with tremendous upside potential even in today’s volatile markets:
3 Stocks to DOUBLE This Year >
BABA shares were trading at $93.29 per share on Wednesday afternoon, up $2.09 (+2.29%). Year-to-date, BABA has gained 5.90%, versus a 20.15% rise in the benchmark S&P 500 index during the same period.
About the Author: Anushka Dutta

Anushka is an analyst whose interest in understanding the impact of broader economic changes on financial markets motivated her to pursue a career in investment research.
The post How is Alibaba (BABA) Holding up as We Near July End? appeared first on StockNews.com