A10 Networks Inc. (ATEN) demonstrated sequential improvements in key financial metrics in the last reported quarter and expects to sustain this positive momentum in the year’s second half.
However, the company faces volatility in spending from large enterprises and tier-one service providers in North America. Therefore, it might be prudent for investors to wait for further improvements before deciding to capitalize on the stock.
The stock is trading below its 50-day and 200-day moving averages of $14.84 and $15.19, respectively, indicating weak momentum. A deeper examination of the trending key financial metrics will further illustrate why this is not an optimal entry point into the stock.
Analyzing A10 Networks Inc.’s Financial Performance and Trends from 2020 to 2023
The trend in the trailing-12-month net income of ATEN indicates a general growth pattern from 2020 to 2023, with specific periods of fluctuation. In chronological order:
- At the end of the third quarter of 2020, the net income was $10.03 million.
- The subsequent recorded amount in the fourth quarter of 2020 was a higher value at $17.82 million.
- The upward growth continued through the first quarter of 2021 ($20.77 million) and the second quarter of 2021 ($23.58 million).
- A significant upsurge occurred by the third quarter of 2021, reaching $92 million.
- This strong growth trend steadied slightly but continued through the fourth quarter of 2021 ($94.89 million), the first quarter of 2022 ($98.58 million), and reaching a peak in the second quarter of 2022 with a reported net income of $102.38 million.
- However, a notable downturn occurred in the third quarter of 2022, with the net income reducing to $39.61 million, approximately a 61% drop from the previous quarter.
- The company rebounded moderately to $46.91 million in the fourth quarter of 2022.
- In the first and second quarters of 2023, the figures showed a minor decrease and then an increase, landing at $45.72 million by the second quarter of 2023.
Comparatively, the net income’s overall growth from the third quarter of 2020 ($10.03 million) to the second quarter of 2023 ($45.72 million) is approximated at a 356% increase. However, observers should note the significant fluctuations within this period, particularly the peak in the second quarter of 2022, followed by a sharp decline in subsequent quarters. These deviations suggest volatility that may impact future trends and should be monitored carefully.

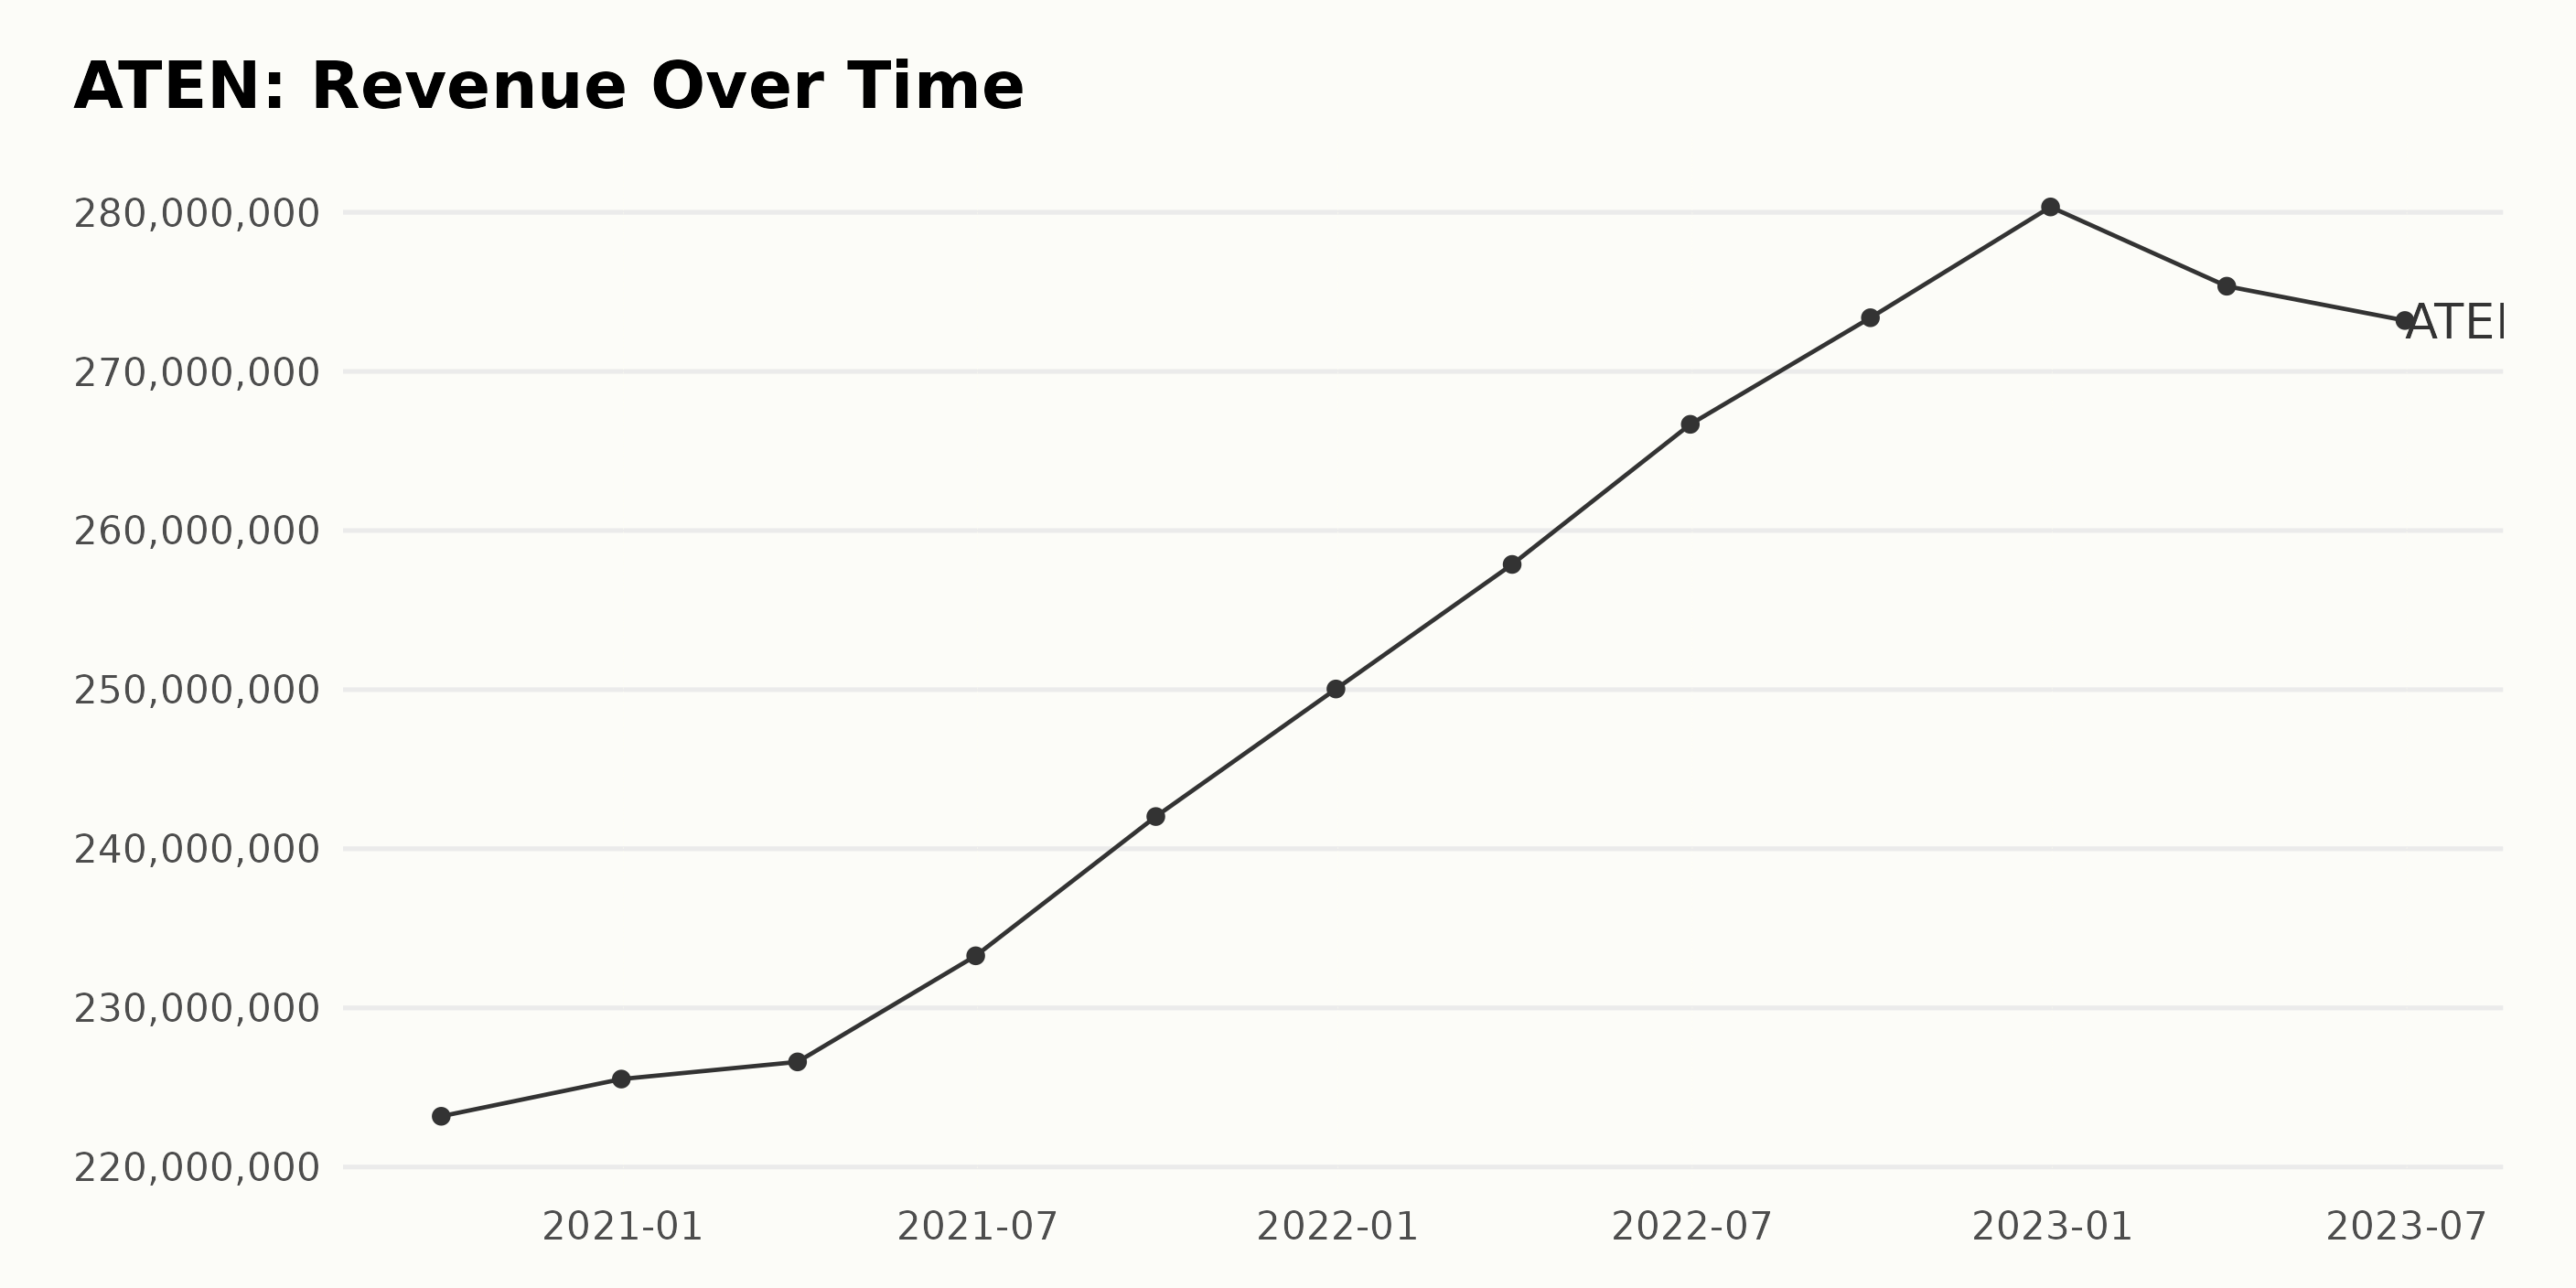
Overview of ATEN’s trailing-12-month revenues
- As of September 30, 2020, the revenue for ATEN was $223.19 million.
- There was a steady rise in revenue throughout 2021, reaching $250.04 million as of December 31, 2021.
- In 2022, the growth trend continued with an impressive jump to $280.34 million by December 31, a significant increase from the previous year.
- However, there was a slight fluctuation noticed in 2023, with revenue dropping to $273.20 million as of June 30.
Growth Rate Calculation: The first recorded revenue data for ATEN is $223.19 million on September 30, 2020, and the latest data point reported is $273.20 million on June 30, 2023. This represents an approximate growth rate of 22.45% over this period.
Recent Trends: Importantly, there has been an upward trend in recent years, with only a mild fall in 2023. The company’s revenue significantly increased from $223.19 million in late 2020 to a peak of $280.34 million at the end of 2022. Despite a slight decrease in 2023, revenue remains robust at $273.20 million, emphasizing the overall growth trend.
Fluctuations: While there has been consistent growth over the years, there have been fluctuations seen quarterly. Notable was the first slight dip seen in the first quarter of 2023 to $275.36 million followed by a further decrease to $273.20 million by mid-year.
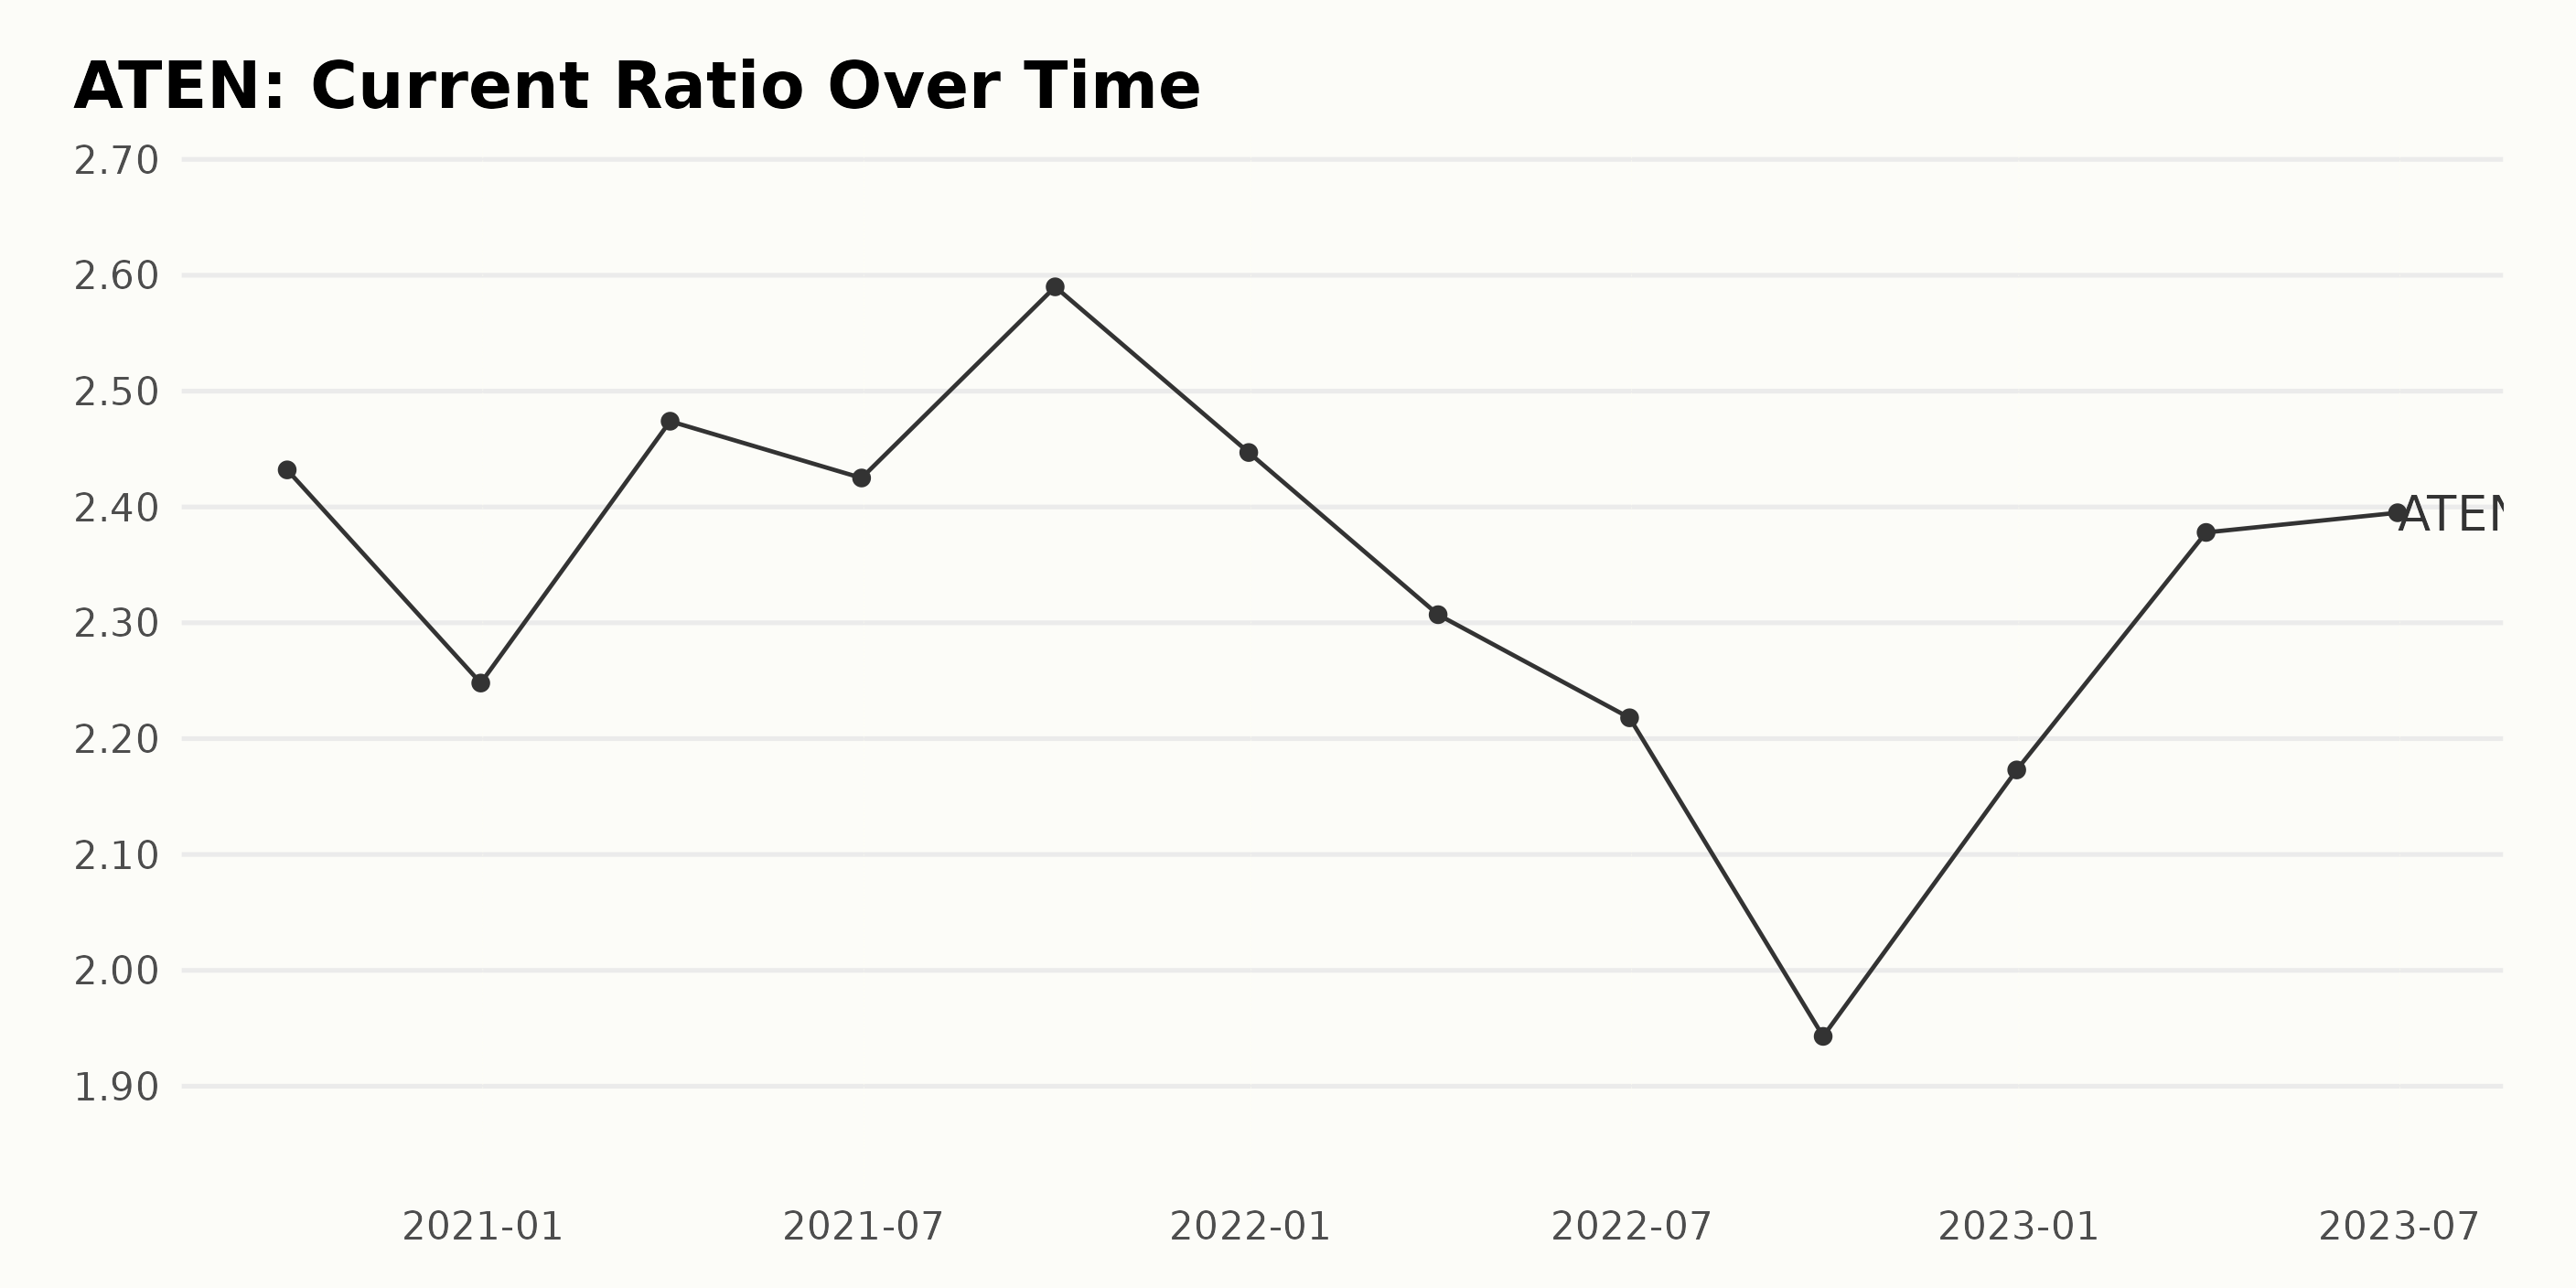
The Current Ratio of ATEN experienced several fluctuations with a generally decreasing trend over the period from 2020 to 2023.
- At the beginning of the observed period, in September 2020, the Current Ratio stood at 2.43.
- The ratio decreased to 2.25 by the end of 2020 (December 2020).
- It then experienced a brief increase to 2.47 in March 2021 before falling slightly to 2.42 by June 2021.
- In September 2021, it went up to 2.59, following which it again started declining, reaching 2.45 by the end of 2021.
- A continued decrease was seen throughout 2022, with a low of 1.94 recorded in September 2022.
- December 2022 noted a recovery, with the ratio rising to 2.17.
- In 2023, there was an upward trend, with the Current Ratio standing at 2.38 in March and 2.40 by June of that year.
Considering the first value (2.43 in September 2020) and the last value (2.40 in June 2023), it reflects a slight negative growth in the Current Ratio (-1.23%) over this measurement period.
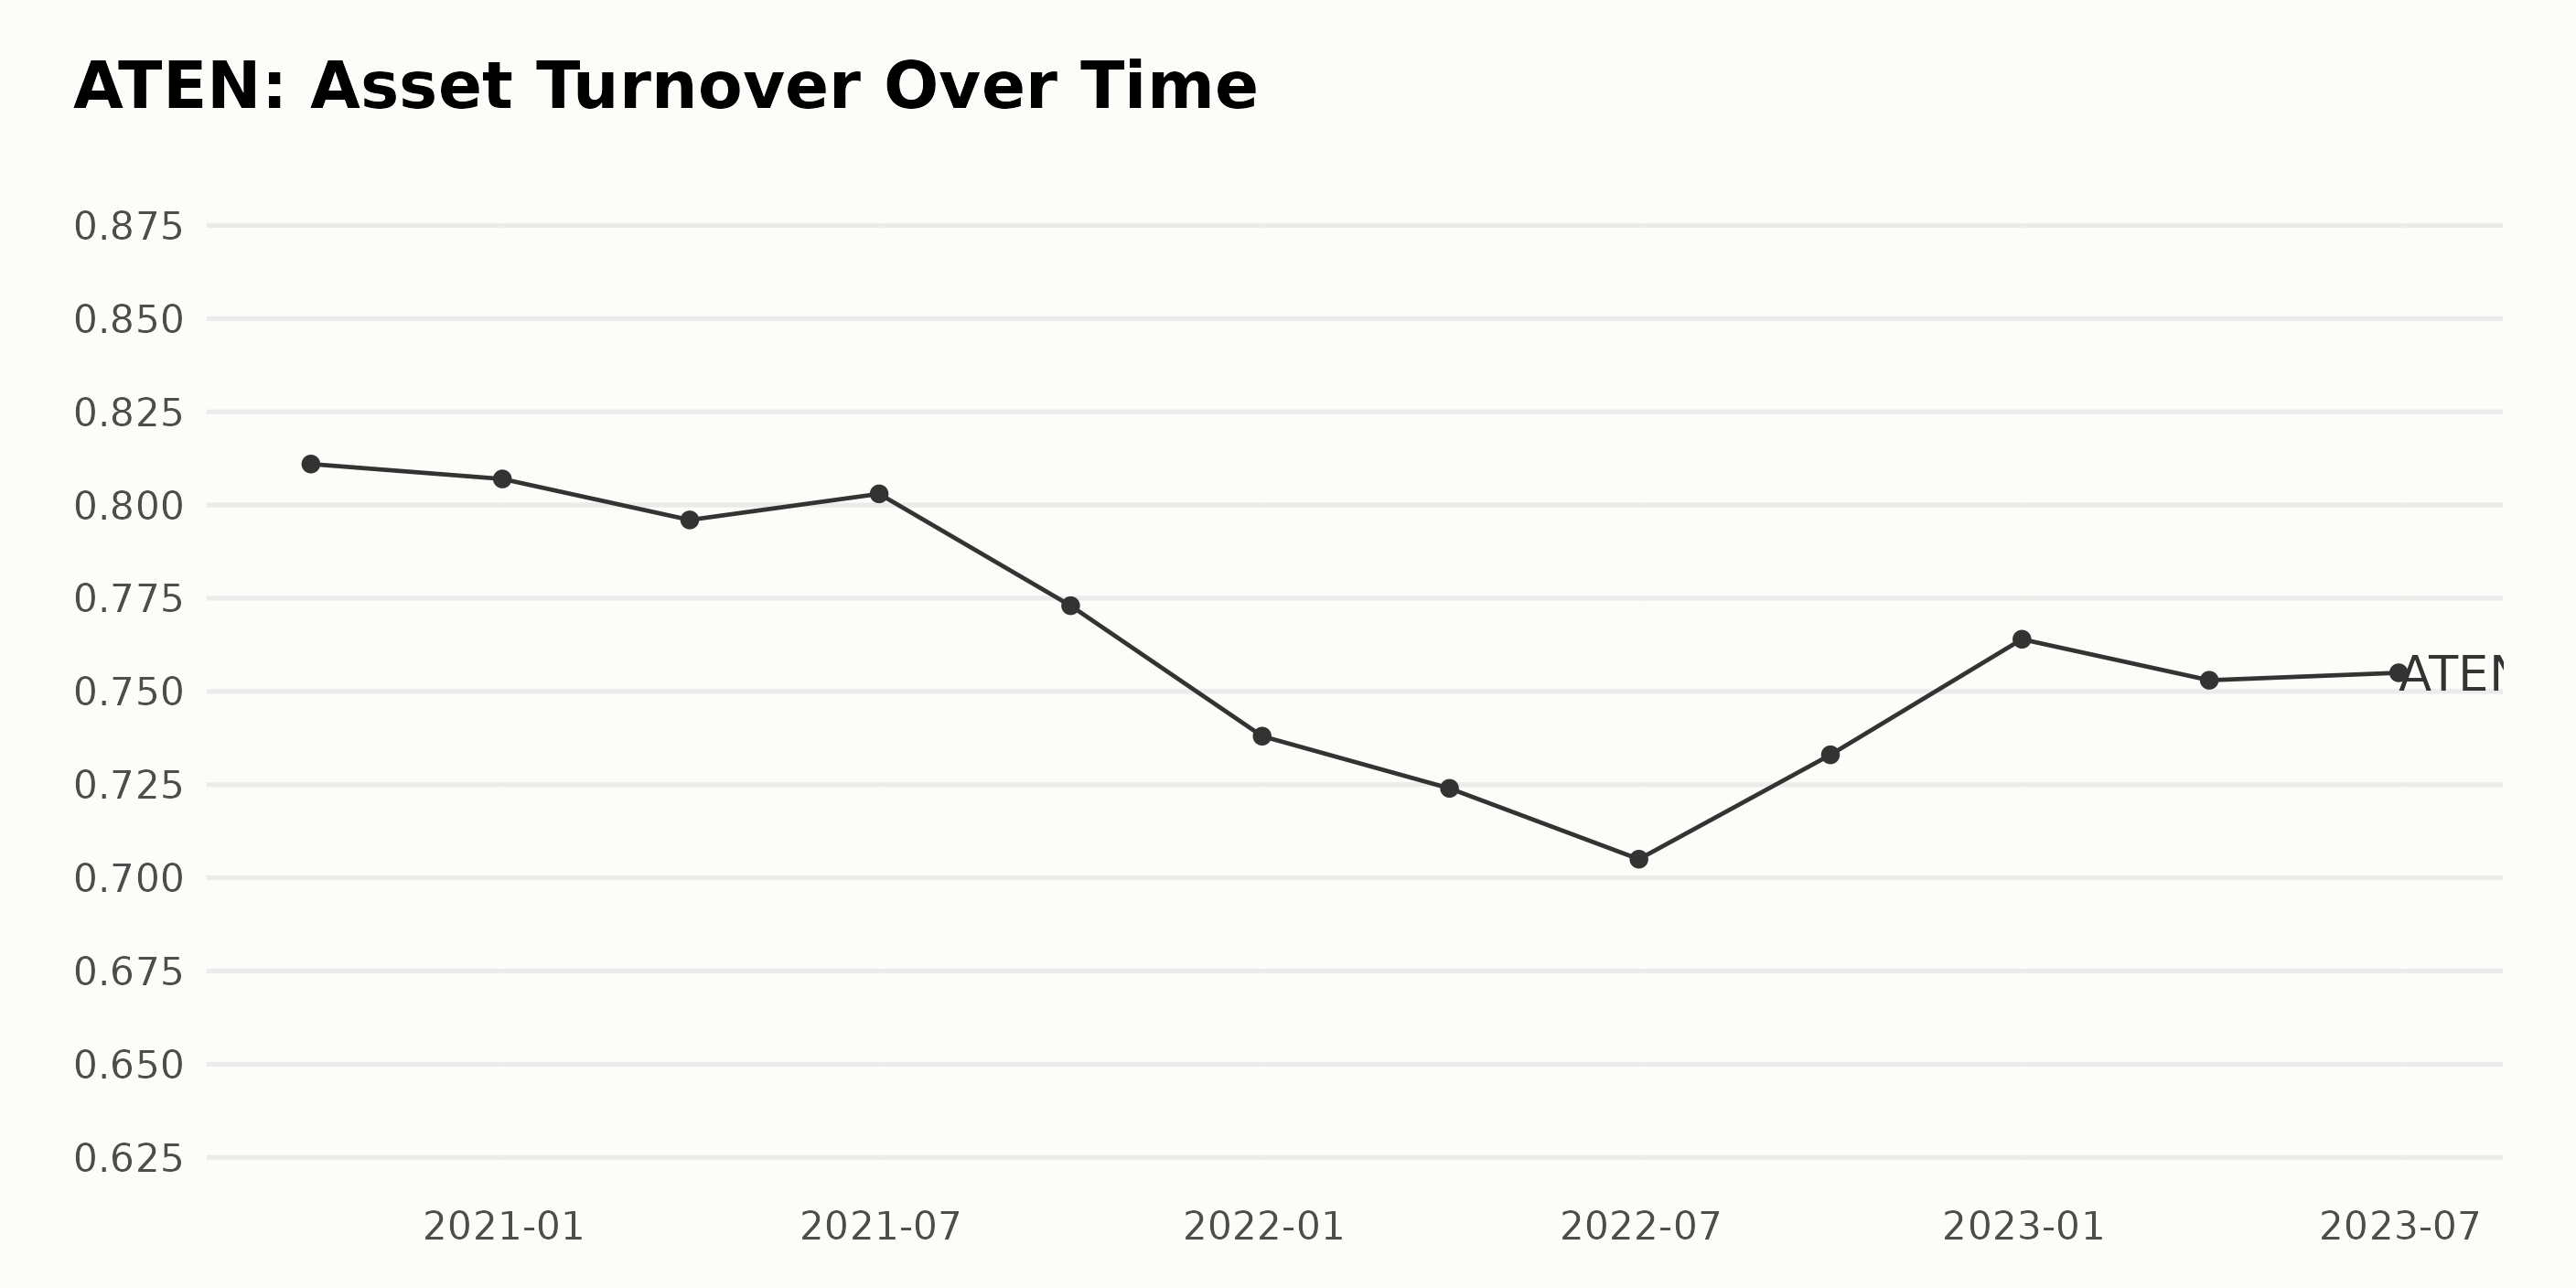
The trend for A10 Networks Inc. (ATEN) ’s Asset Turnover shows a general decrease from September 2020 to June 2022, though there is a moderate increase later. The series demonstrates some fluctuations, and, as requested, the most recent data holds more weight in the analysis.
- From September 2020 onward, ATEN’s Asset Turnover begins at 0.81 (September 30, 2020) but slowly decreases to 0.76 (December 31, 2022).
- Within this decreasing trend, minor fluctuations are observable, wherein we see a slight rise from 0.80 (June 30, 2021) to 0.77 (September 30, 2021). - However, the lowest value was seen on June 30, 2022, at 0.71, which was a significant decrease from 0.72 (March 31, 2022)
- From this low point onwards, beginning June 30, 2022, a resurgence in the Asset Turnover was observable. It rose from 0.71 to 0.76 within a span of six months (December 31, 2022). This is marked by a peak of 0.76 at the end of this period.
- Ostensibly, the first quarter of 2023 signaled another slight dip in the Asset Turnover to 0.75 (March 31, 2023), but it slightly recovered again at the same value of 0.75 (June 30, 2023).
In terms of growth rate, if we measure the first value from the last, an overall decreasing trend is observed. If we consider the initial reported Asset Turnover as 0.81 (September 30, 2020) and the final as 0.76 (June 30, 2023), we see a decrease of approximately -6.17%. It’s worth noting that the overall difference might be small, yet it reflects the company’s diminishing efficiency in generating sales from assets over this period. Further investigation may be required to identify the causative factors.
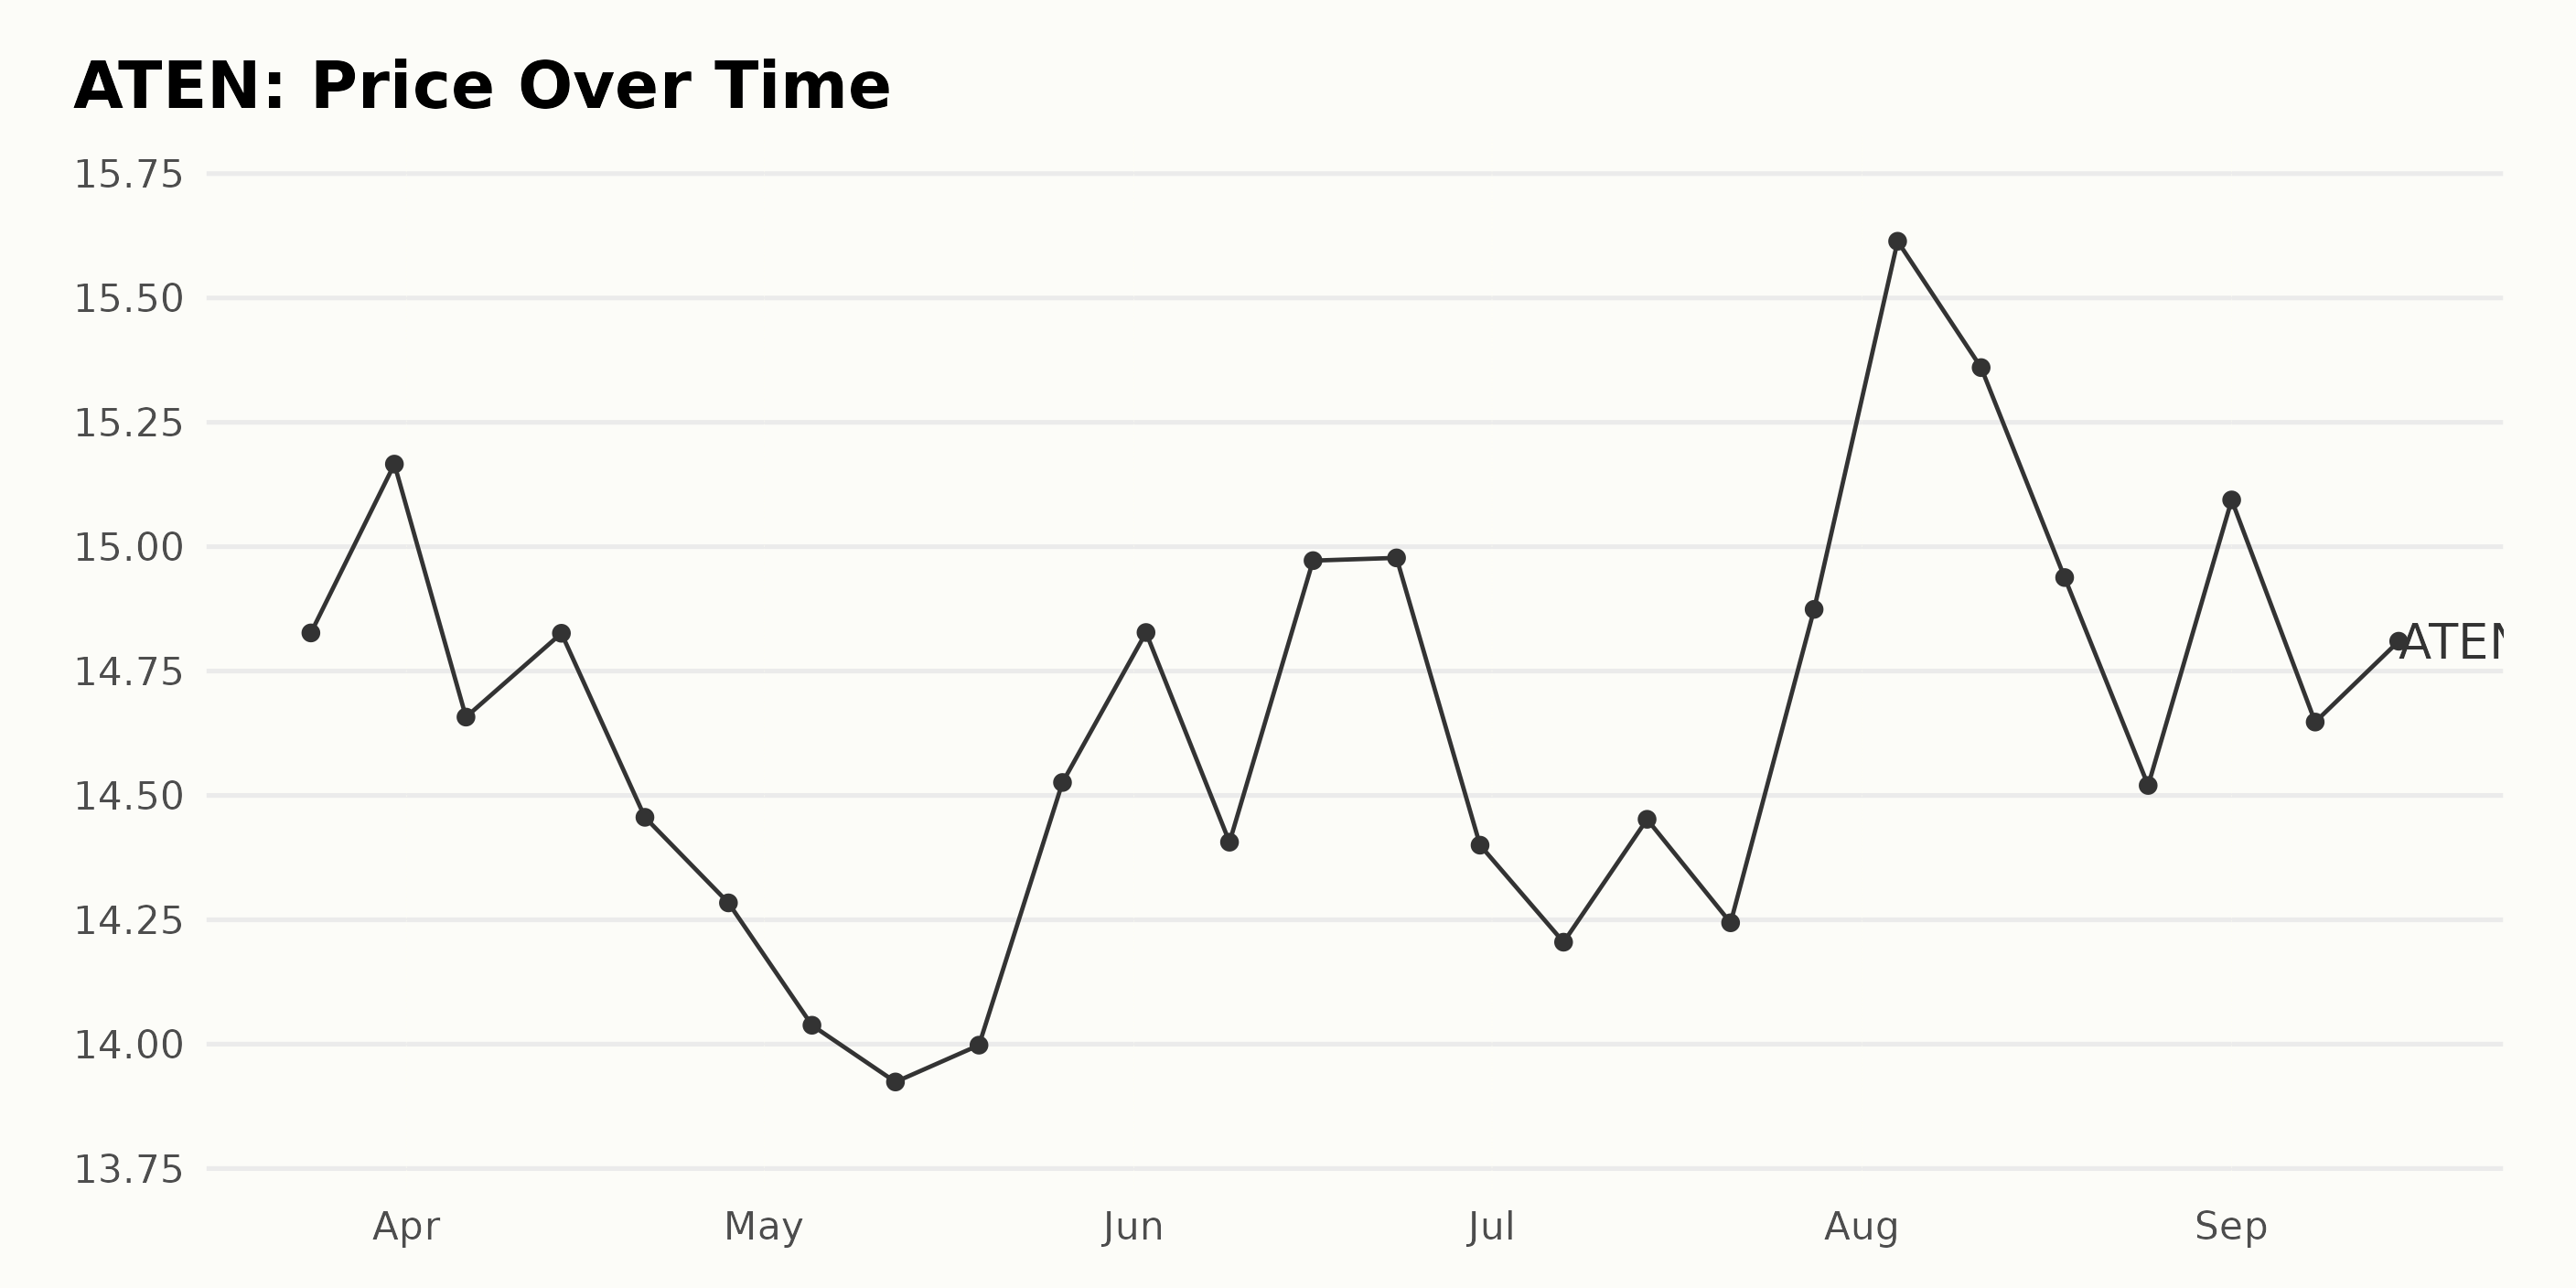
Analyzing A10 Networks Inc.’s Six-Month Share Price Fluctuations and Growth Trend
Upon analyzing the given data of A10 Networks Inc. (ATEN) from March 24, 2023, to September 15, 2023, the following trends and growth rates can be discerned:
- On March 24, 2023, ATEN had a share price of $14.83. By the end of the month, there was a slight rise, setting the share price at $15.17.
- In April, the share price experienced volatility, starting at $14.66 and peaking at $14.83 before falling to $14.28 by the end of the month.
- May saw a further decrease in the share price, starting at $14.04 and dipping to $13.92, before rebounding to $14.53 by month’s end.
- The trend in June showed an overall increase in share price despite fluctuations throughout the month. The share price rose from $14.83 to $14.98 mid-month but fell back down to $14.40 by the end of June.
- July followed a similar trend as June, with share prices starting at $14.21 and increasing to $14.45 mid-month, only to fall back to $14.24 before bouncing back to $14.87 at month-end.
- In August, the share price peaked for this period at $15.61 at the beginning of the month but gradually declined to $14.52 by August 25, 2023.
- By September, the share price increased to $15.09 early in the month, followed by a slight drop, ending the period at $14.61 on September 15, 2023.
The growth rate of ATEN’s share price fluctuated throughout the six-month period. However, it is noticeable that despite the sporadic nature of the share prices, the value demonstrated a slight increasing trend overall. Here is a chart of ATEN’s price over the past 180 days.
Evaluating A10 Networks Inc.’s Quality, Momentum, and Growth Ratings in 2023
ATEN has an overall C rating, translating to a Neutral in our POWR Ratings system. It is ranked #17 out of the 51 stocks in the Technology - Communication/Networking category.
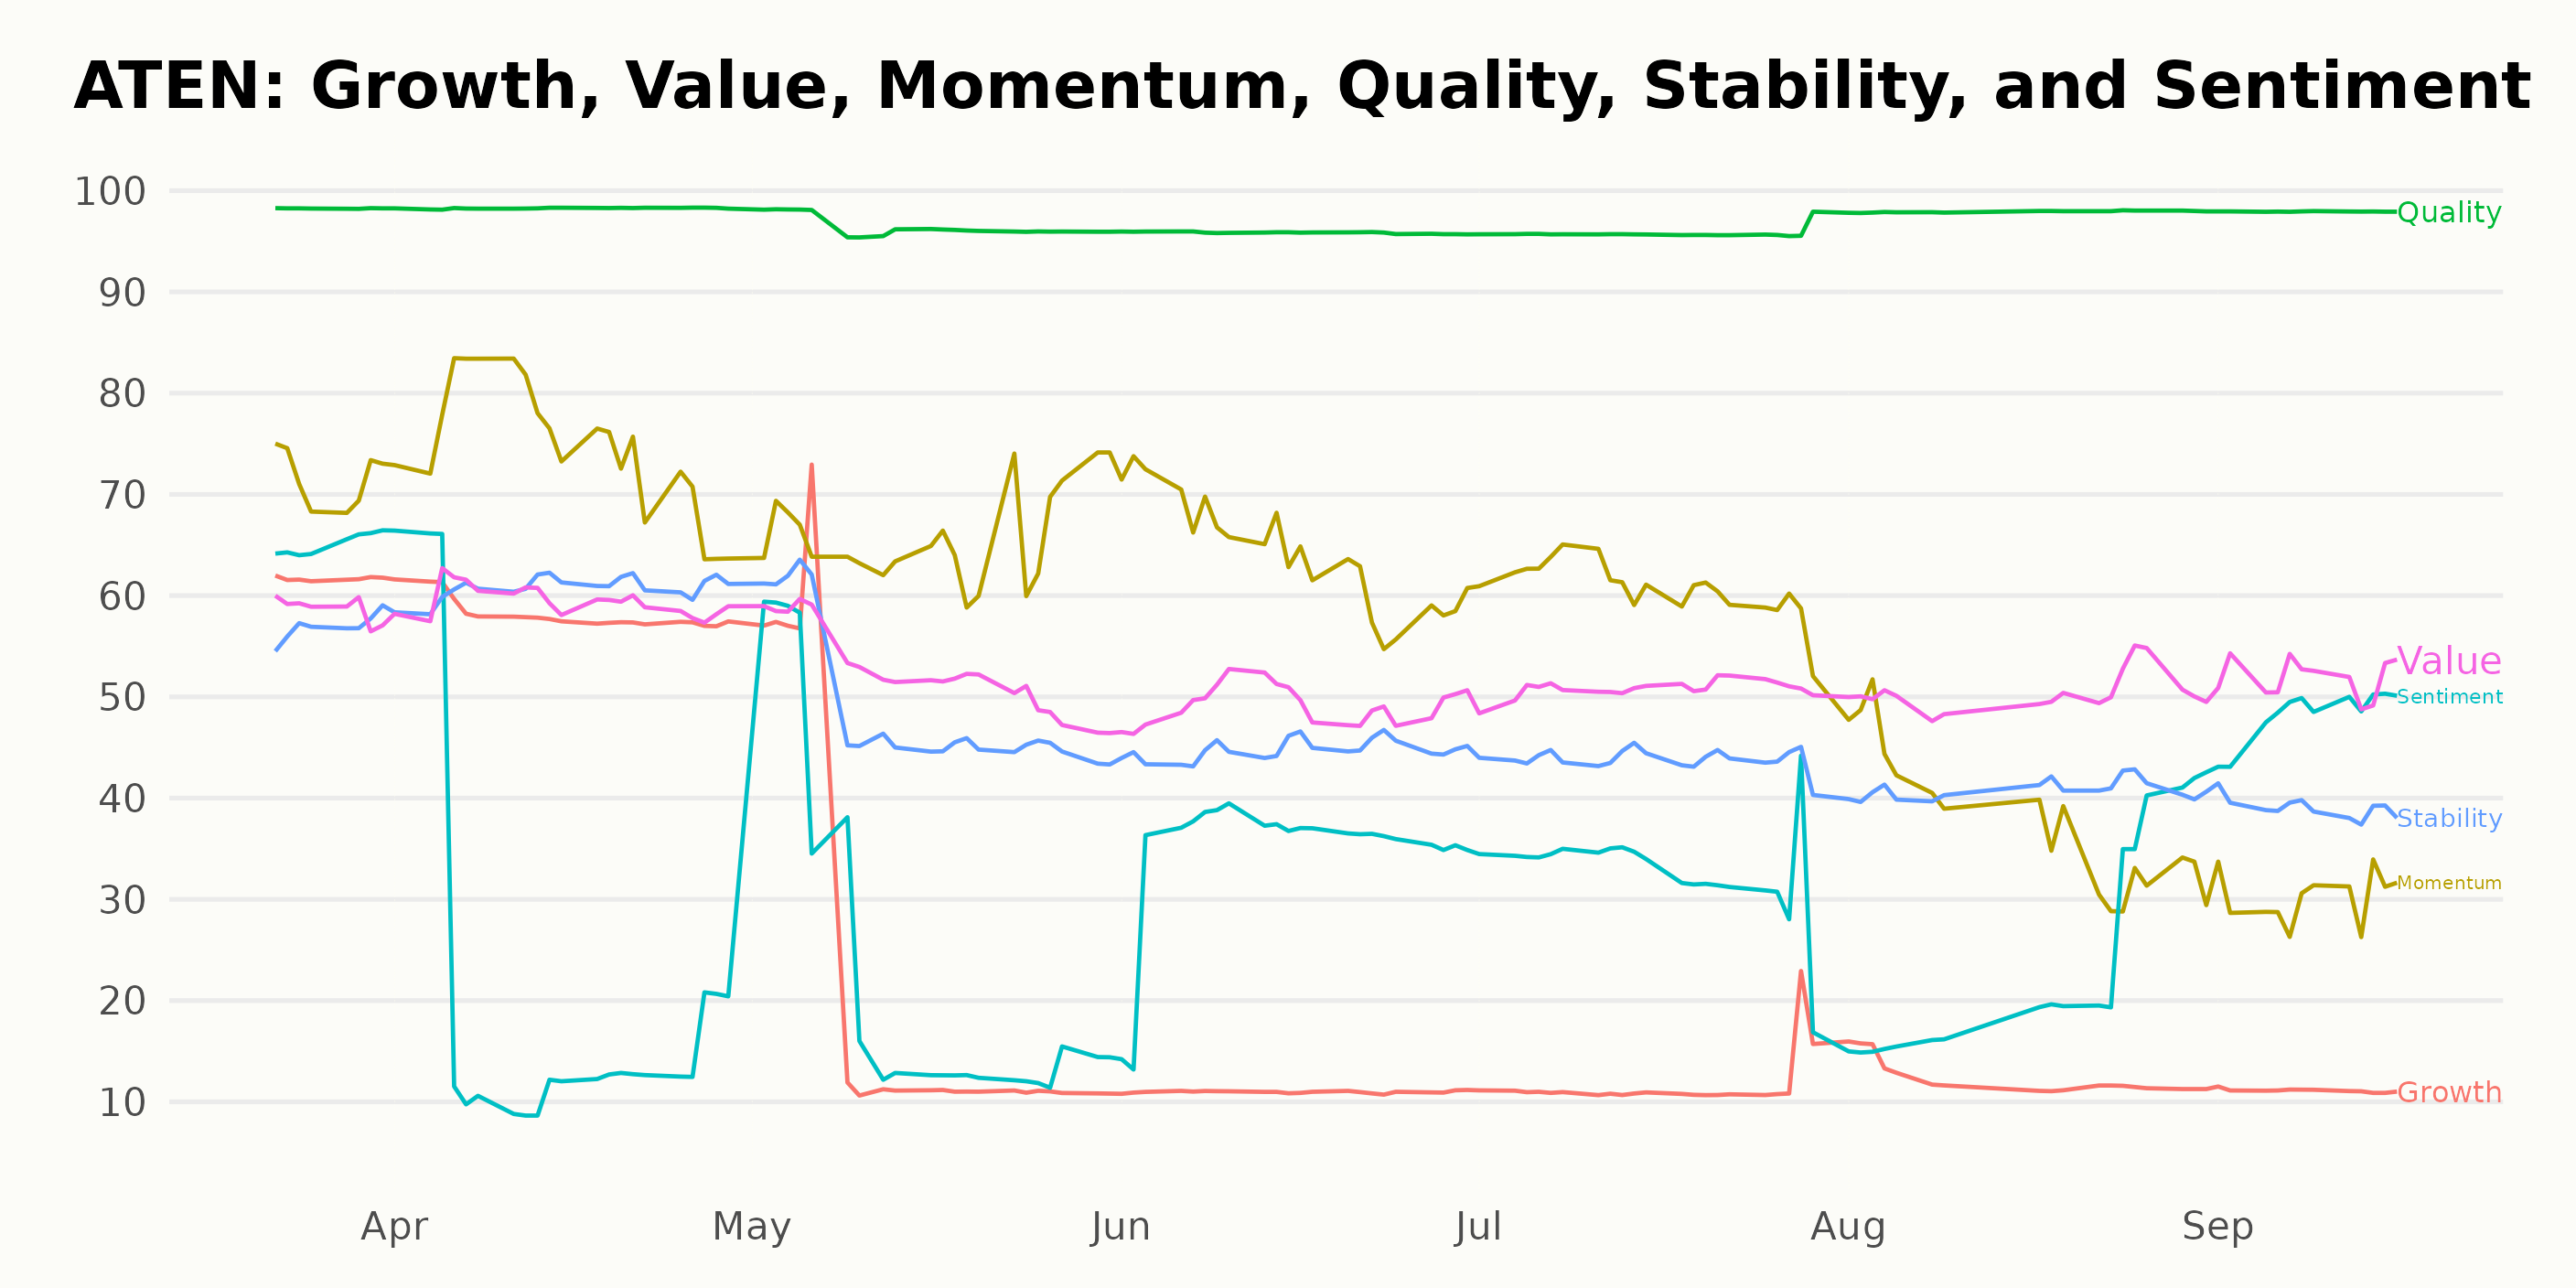
Based on the POWR Ratings, the three most noteworthy dimensions for ATEN are Quality, Momentum, and Growth. Here are some highlights:
Quality:
- In March 2023, the quality dimension was rated at 98, which was the highest among all dimensions.
- This rating continued to hold consistently high, staying steady at 98 for April 2023 and ending up adjusting slightly to 96 from May to July 2023.
- By August 2023, the rating climbed back up to 98, keeping its position as the most well-rated dimension, and it continued to maintain this rating through September 2023.
Momentum:
- The momentum dimension kicked off with a rating of 72 in March 2023.
- It increased to its peak of 75 in April 2023 before experiencing a steady decline to reach a low of 30 by September 2023.
Growth:
- Starting with a rating of 62 in March 2023, the growth dimension saw a notable trend of consistent decline over the months,
- It dipped to 58 in April 2023, decreased significantly to 23 by May 2023, and continued to drop until it reached a point of 11 by June 2023.
- After maintaining a similar level throughout the summer of 2023, the growth dimension rating lingered at 11 in September 2023.
These trends indicate a strong standing in terms of Quality for A10 Networks Inc., though showing a falling trend in Momentum and Growth over the period of March to September 2023.
Stocks to Consider Instead of A10 Networks Inc. (ATEN)
Other stocks in the Technology - Communication/Networking sector that may be worth considering are PC-Tel Inc. (PCTI), Eutelsat Communications S.A. (ETCMY), and Cisco Systems Inc. (CSCO) -- they have better POWR Ratings.
43 Year Investment Pro Shares Top Picks
Steve Reitmeister is best known for his timely market outlooks & unique trading plans to stay on the right side of the market action. Click below to get his latest insights…
Steve Reitmeister’s Trading Plan & Top Picks >
ATEN shares were unchanged in premarket trading Monday. Year-to-date, ATEN has declined -10.76%, versus a 16.82% rise in the benchmark S&P 500 index during the same period.
About the Author: Subhasree Kar

Subhasree’s keen interest in financial instruments led her to pursue a career as an investment analyst. After earning a Master’s degree in Economics, she gained knowledge of equity research and portfolio management at Finlatics.
The post A10 Networks (ATEN) Stock Analysis: To Buy or Not to Buy This Tech Stock? appeared first on StockNews.com