The OPEC group has been cutting supplies since late 2022 to support the oil market. Despite a fall in oil prices recently, the group remains “cautiously optimistic” about oil market dynamics for 2024.
Against this backdrop, energy services firm Halliburton Company (HAL) reported sound results for the third quarter (ended September 30), with its adjusted net income per share of $0.79 topping the expected $0.77.
However, the company experienced some weakness in North America due to decreased pressure pumping services in the United States and lower well intervention services in the Gulf of Mexico. North American revenue declined 3% sequentially to $2.6 billion.
Given this mixed scenario, let’s look at the trends of HAL’s key financial metrics to understand why it could be wise to wait for a more opportune moment to invest in the stock.
Charting Halliburton Company's Financial Health: A Three-Year Performance Overview
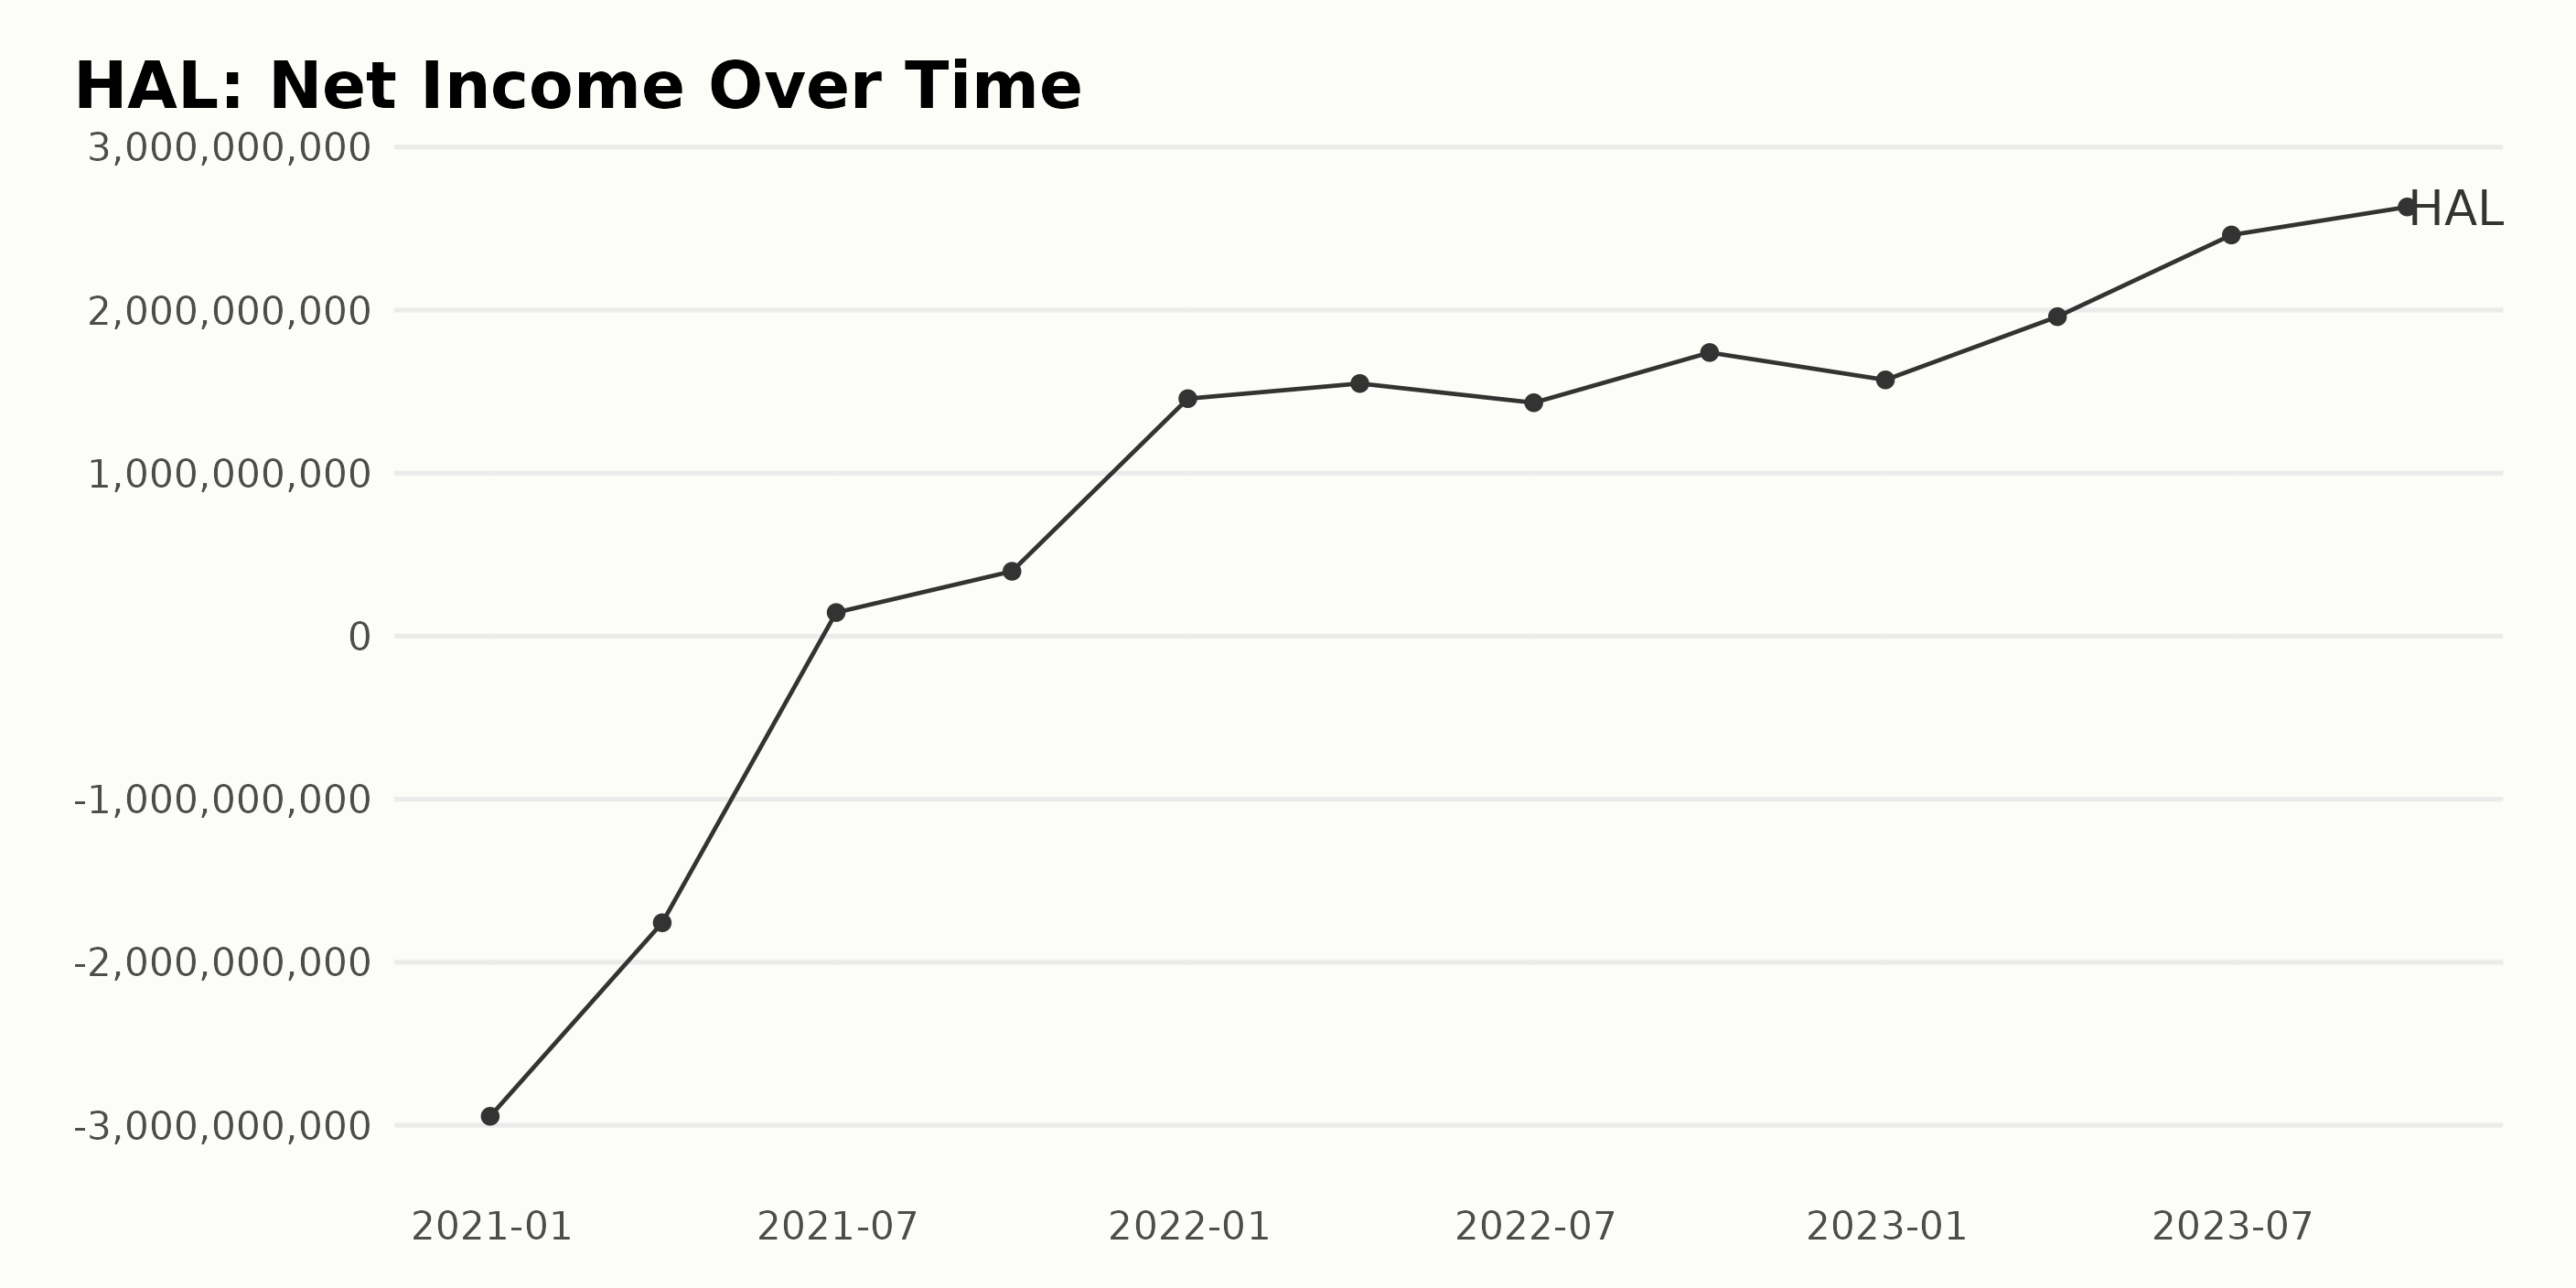
To summarize, the trailing-12-month net income of HAL has shown drastic fluctuations over the past few years. In 2020, their net income was negative, meaning they experienced financial loss, followed by a period of significant recovery and growth.
- The December 31, 2020, net income value stood at a negative value of -$2.95 billion.
- By the end of the first quarter of 2021, HAL's net income was still negative, recorded at -$1.76 billion, showing improvements compared to the previous year.
- Beginning in the second quarter of 2021, HAL managed to turn things around and experience positive net income. By June 30, 2021, their net income had risen to $145 million.
- This pattern of growth continued steadily throughout 2021 and 2022. By December 31, 2022, the net income had risen to $1.57 billion, marking a significant recovery from the losses observed in 2020.
- Furthermore, there remains consistent growth through the first three quarters of 2023. The June 30, 2023 net income has grown to $2.46 billion. And as of September 30, 2023, HAL's net income was reported to have grown even further, reaching $2.63 billion.
As a growth rate from the previously negative value in 2020 to the last recorded value in 2023, it represents an absolute increase in net income. However, the trend analysis shows some fluctuations with periods of slower growth (like between December 2022 and March 2023).
The overall trajectory for HAL's net income, based on this data series, is a positive upward momentum. This increasing trend demonstrates a strong recovery and financial growth.
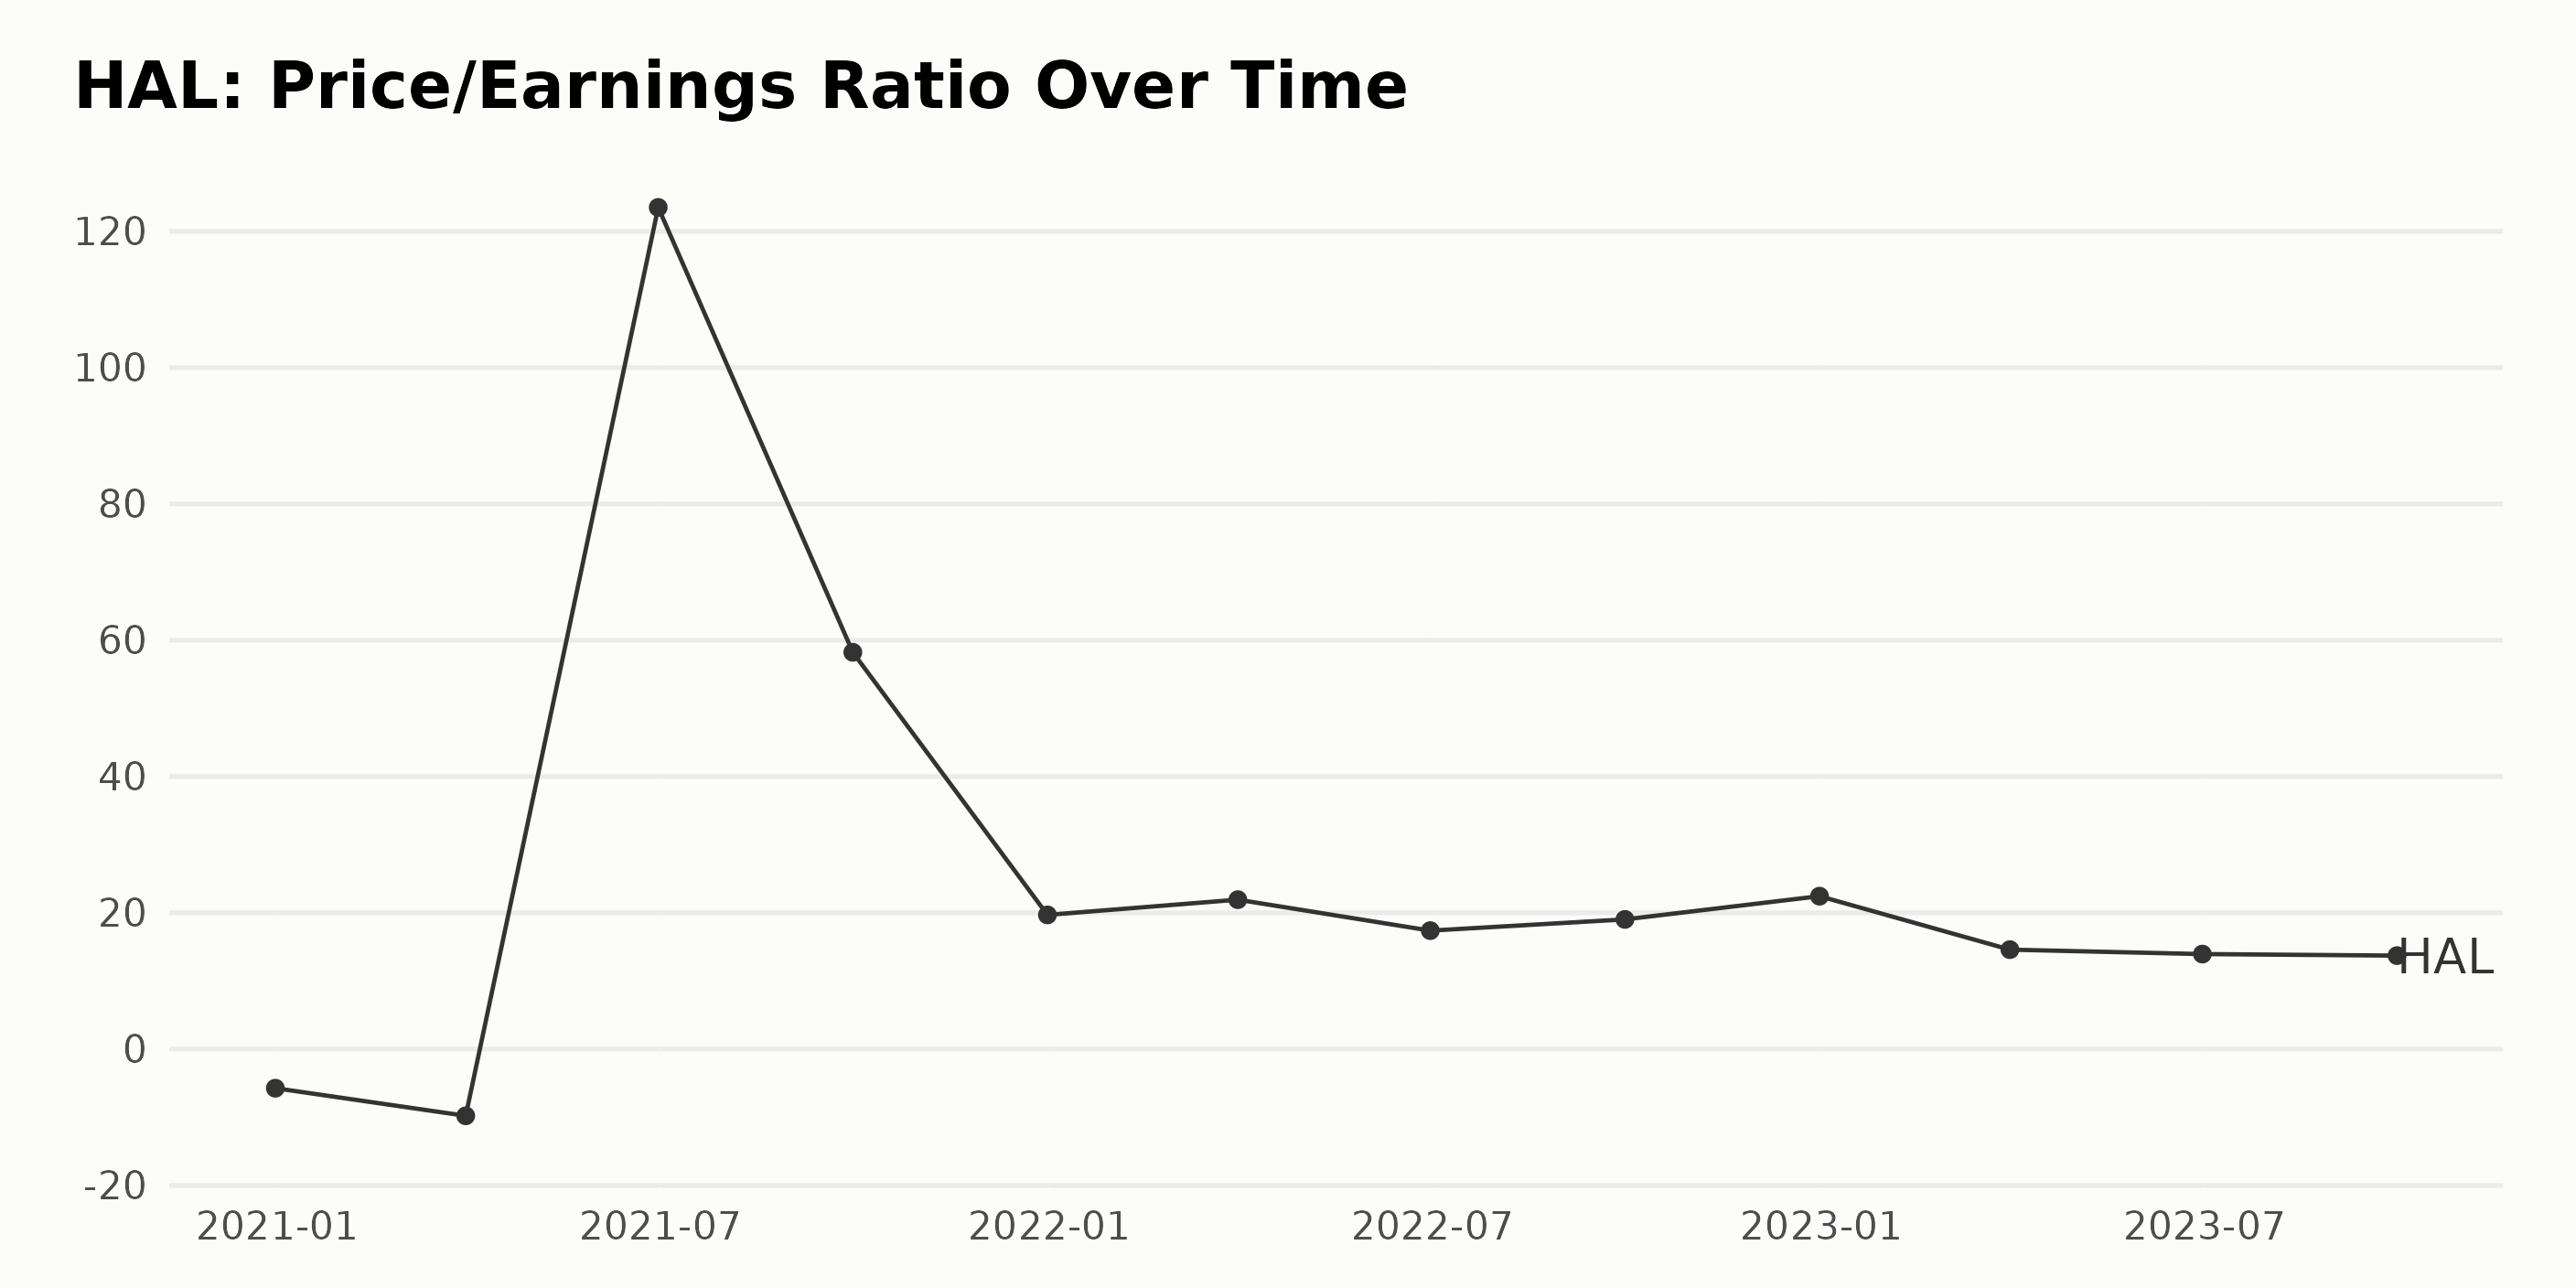
The Price/Earnings ratio (P/E) of HAL exhibits considerable fluctuations from December 2020 to September 2023. Notably:
- As of December 2020, the P/E ratio was -5.73, suggesting the company was not profitable during this period.
- These negative earnings persisted into March 2021, where the P/E ratio fell further to -9.78.
- A significant spike in the P/E ratio was observed in June 2021, reaching a high of 123.50.
- The following months saw the P/E ratio shrink, dropping to 58.23 at the end of September 2021 and then sharply declining to 19.70 by the end of December 2021 - a fluctuation of about 67% within this quarter.
- Throughout 2022, the P/E maintained relative stability ranging between 17.39 and 22.45, ending December with a P/E of 22.45.
- In 2023, from March onward, there's evident contraction, with the P/E ratio decreasing steadily from 14.60 to 13.73 by September.
When measuring the last value from the first value, the growth rate shows a growth of approximately 339.96%. It is important to note, however, that this growth has been highly irregular and subject to severe fluctuations, particularly in the year 2021. The past years' data suggests a potential stabilizing trend in the future.
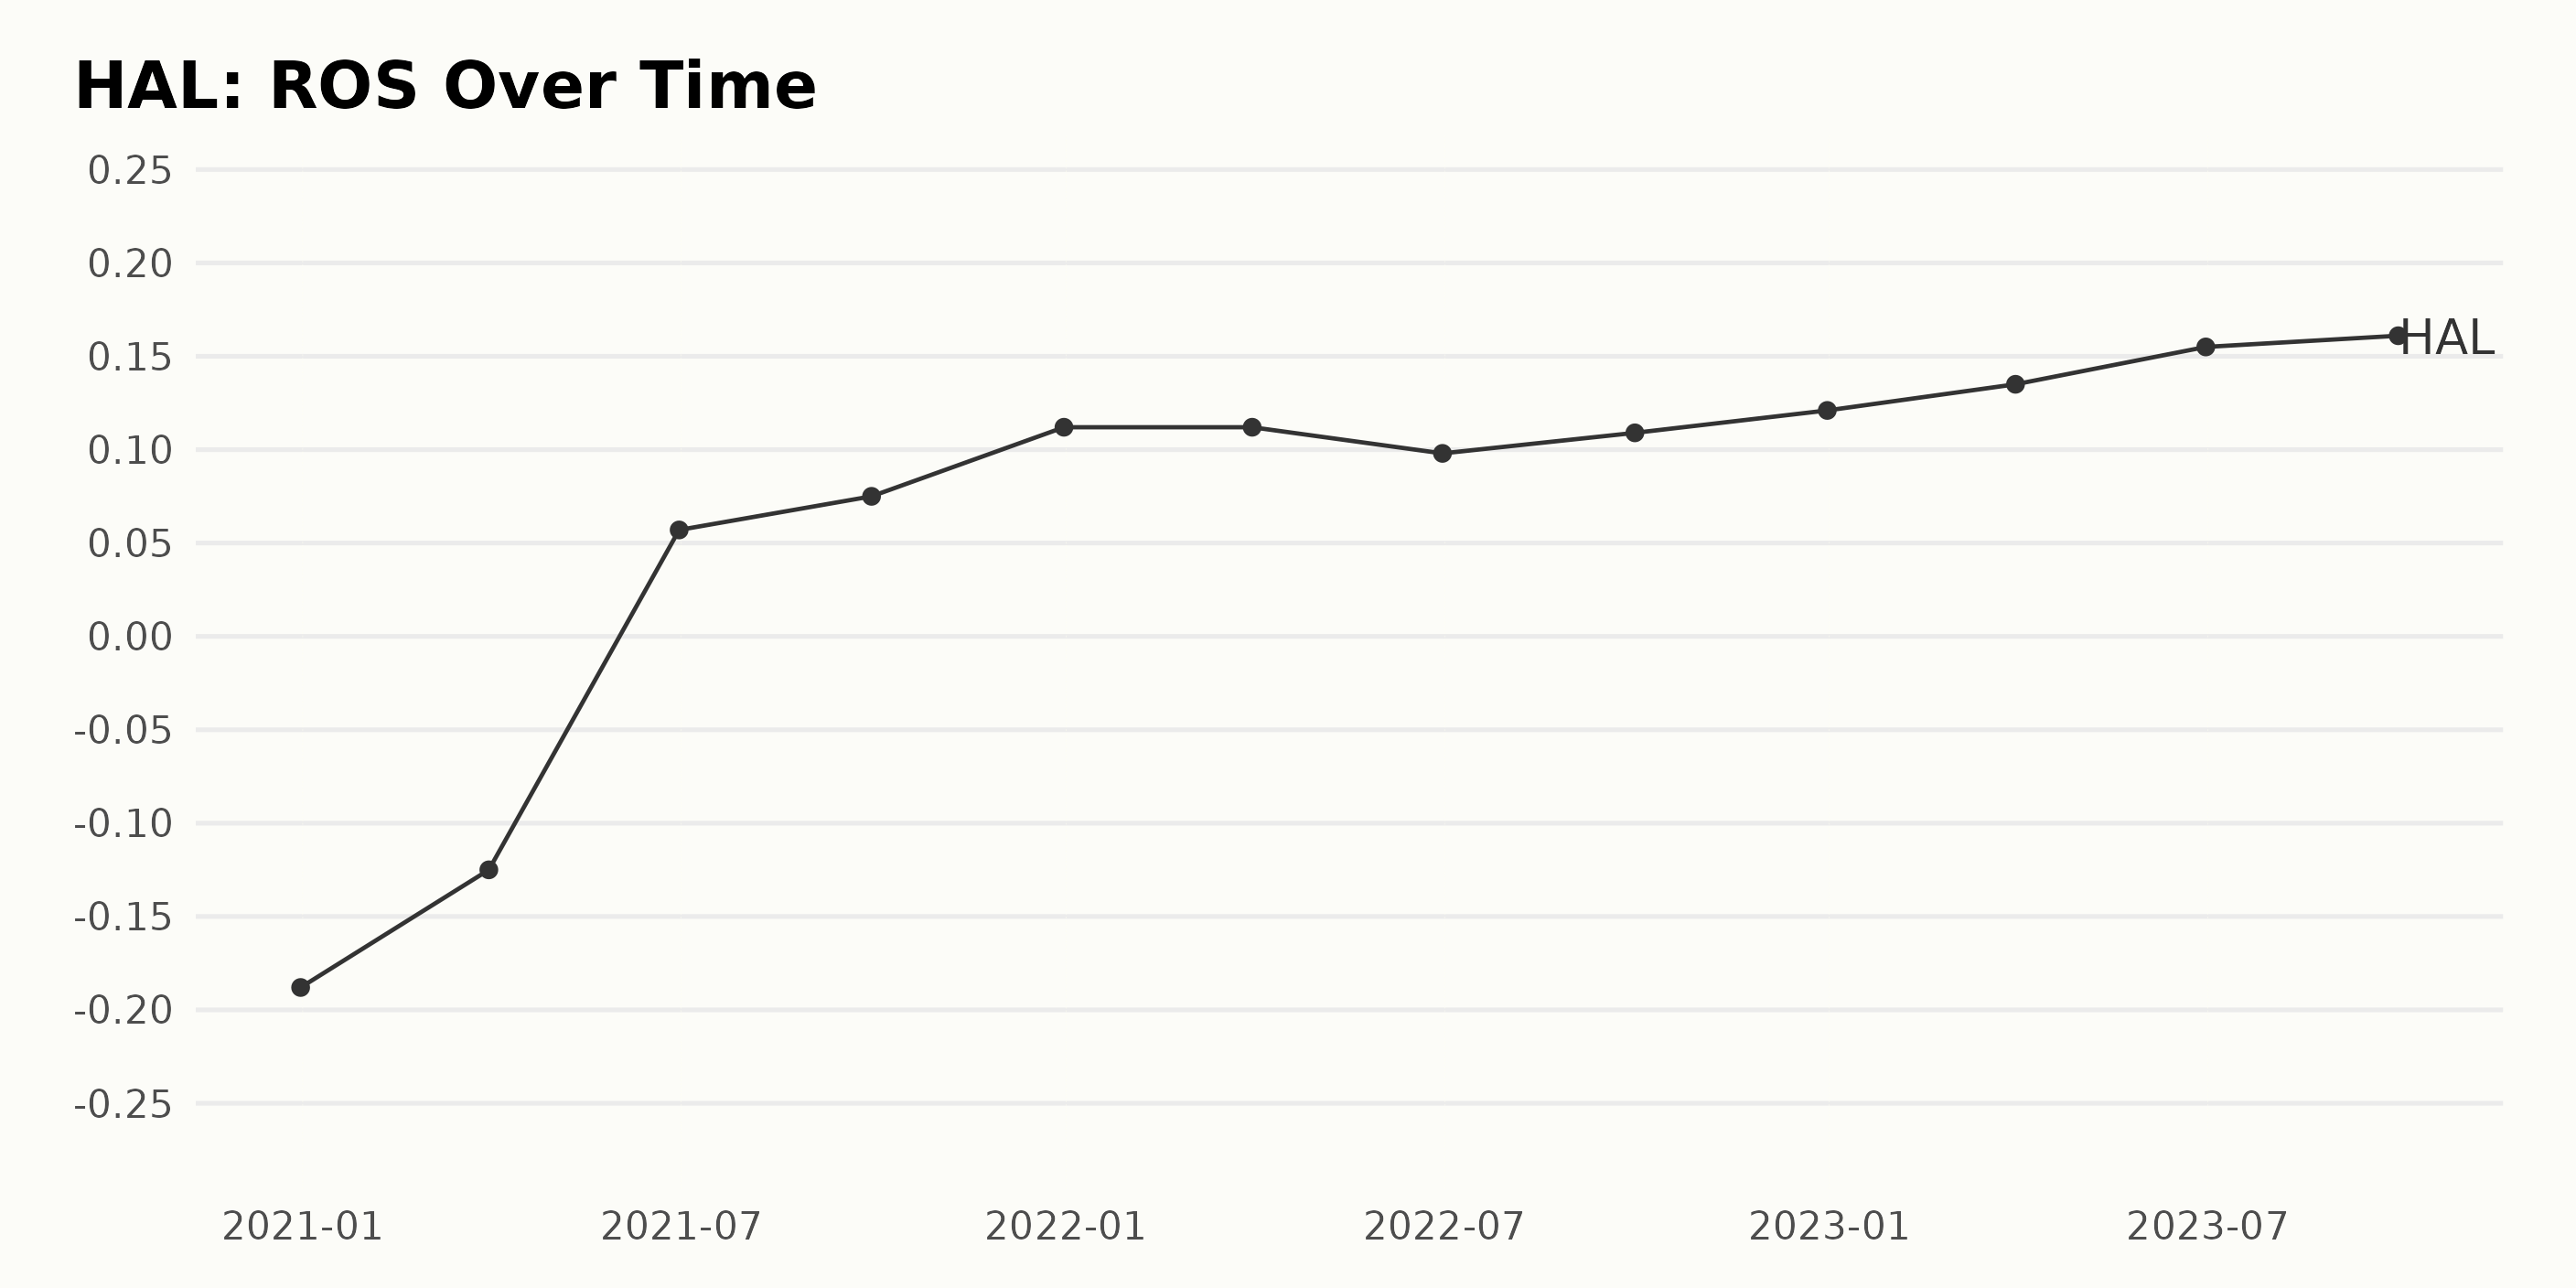
The Return On Sales (ROS) trend for HAL has seen significant fluctuations from December 31, 2020, to September 30, 2023. Here are the key points:
- From December 31, 2020, to March 31, 2021, HAL's ROS showed a slightly improving trend, although remaining in the negative territory. The ROS value improved from -0.19 to -0.13.
- The company entered positive ROS territory on June 30, 2021, with a ROS of 0.057, marking a substantial turnaround.
- This was followed by steady improvement throughout the rest of 2021 and the first half of 2022, with the ROS increasing to 0.098 by June 30, 2022.
- However, a slight dip was observed from 0.112 on March 31, 2022, to the ROS standing at 0.098 on June 30, 2022.
- Despite this transitory fall, the overall upward trend continued, hitting 0.121 by the end of 2022.
- The growth persisted throughout 2023, culminating at a ROS of 0.161 as of September 30, 2023.
In summary, after a period of negative ROS values, HAL demonstrated strong fiscal recovery and sustained improvement in its return on sales. Over the entire period, there has been a marked increase from an initial value of -0.188 at the end of 2020 to a final value of 0.161 by September 2023, representing a notable shift in financial performance.
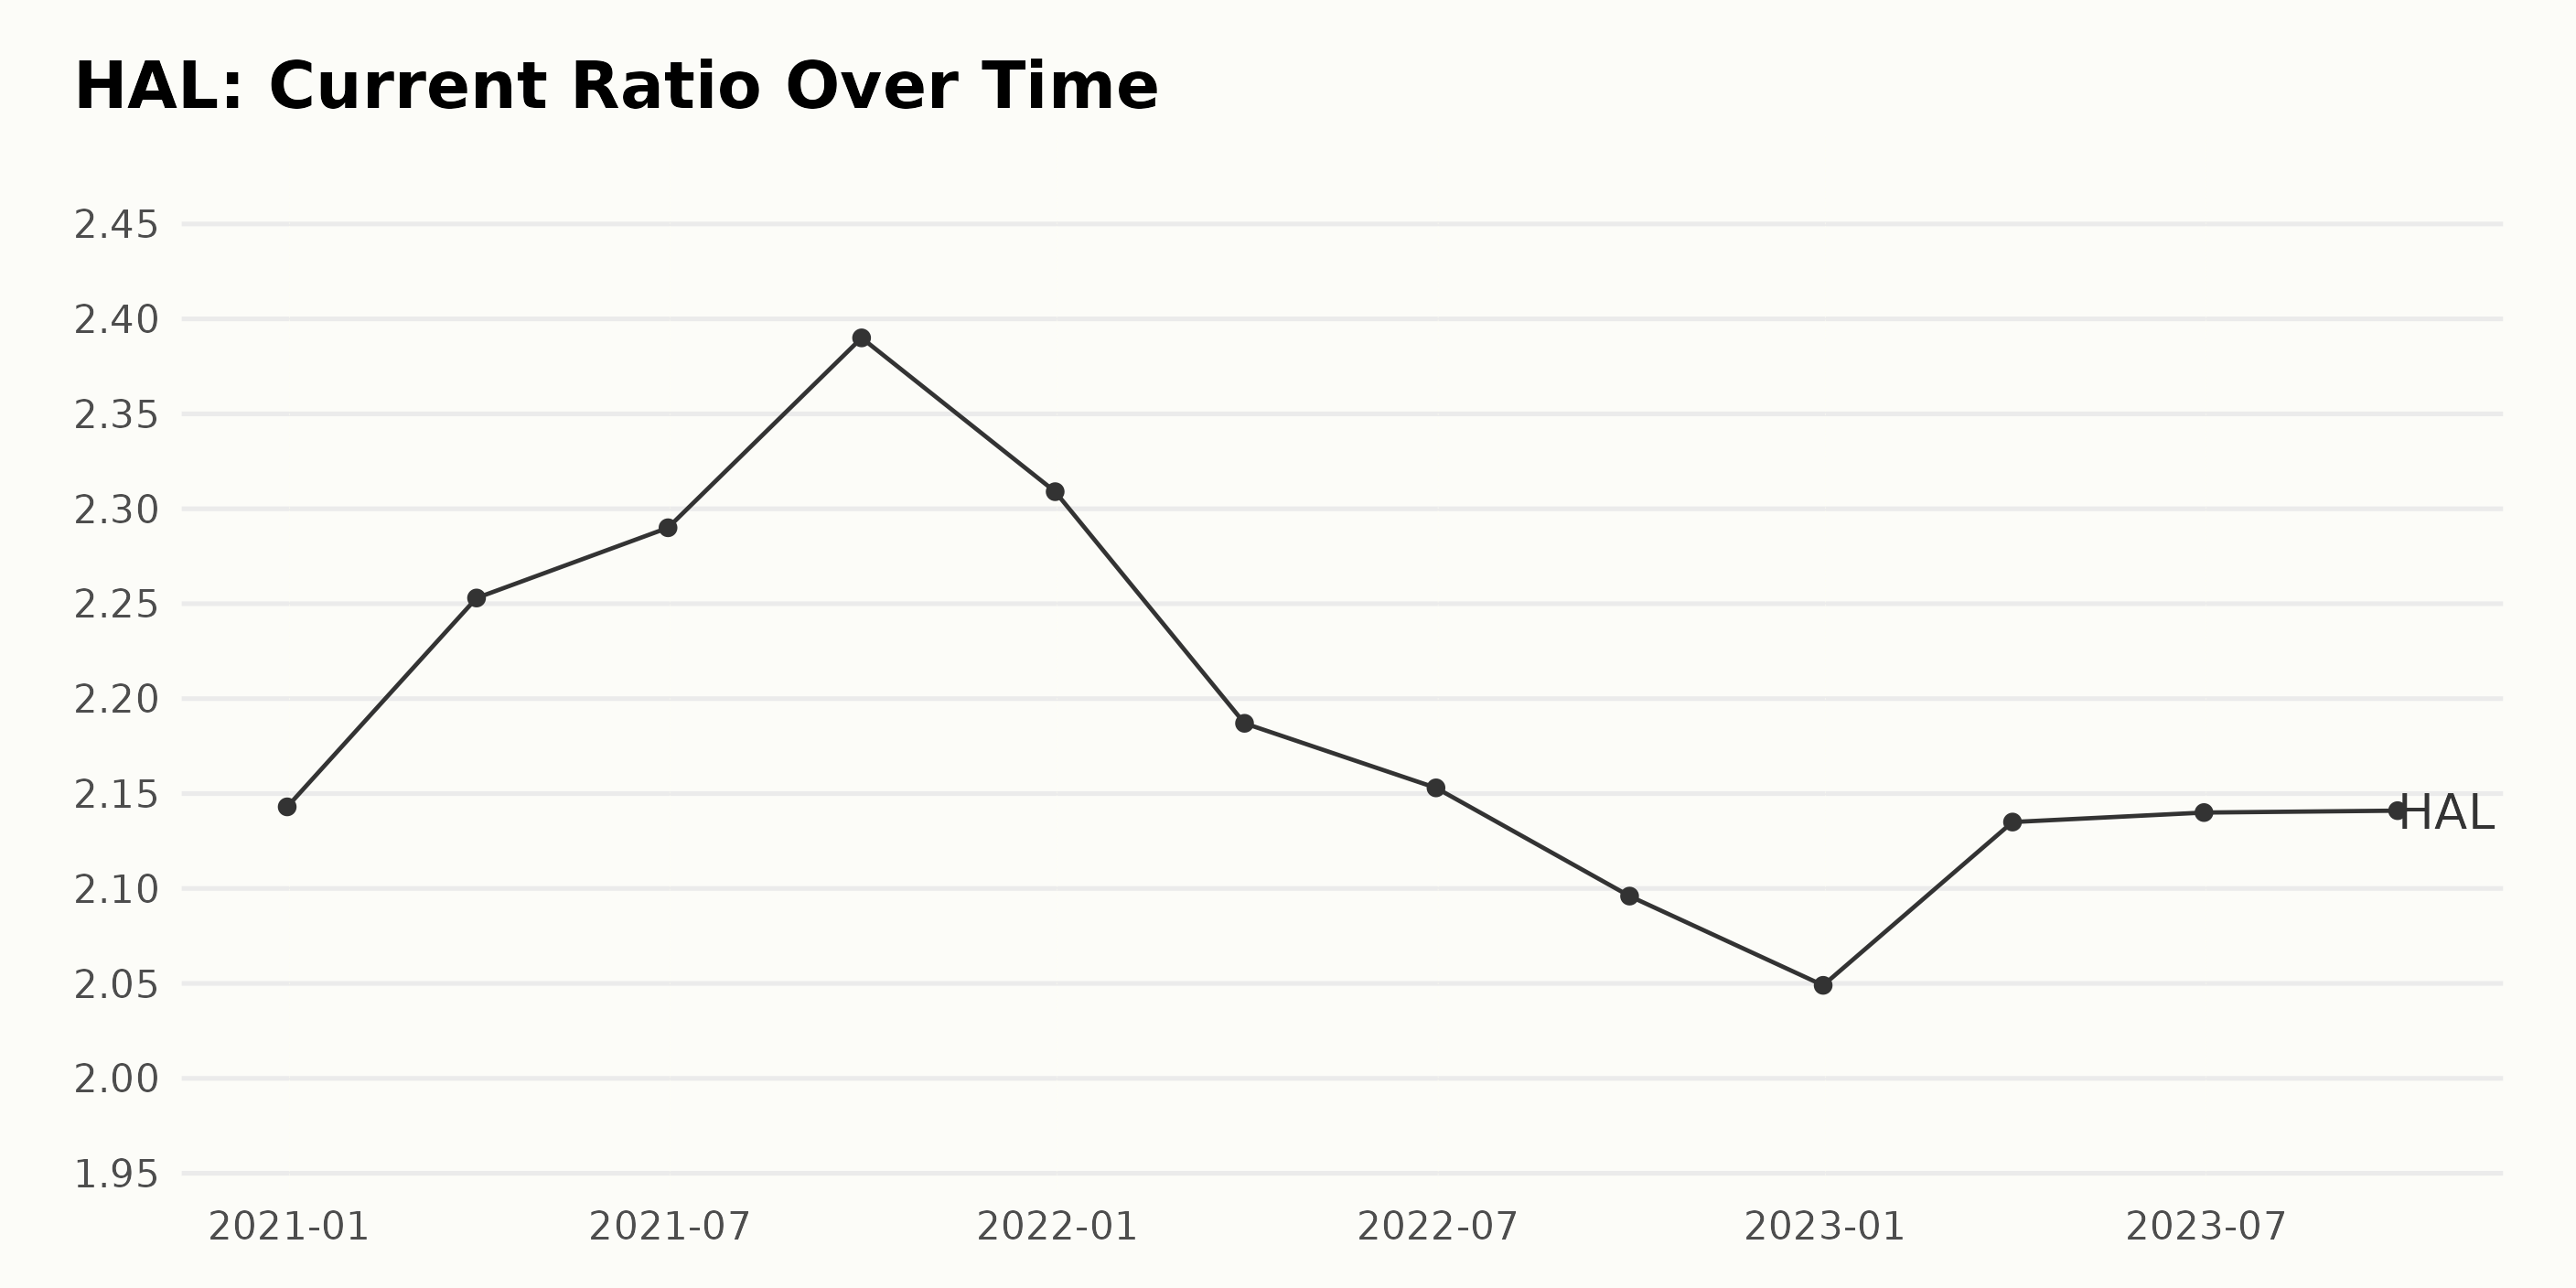
Based on the provided data, the general trend of the current ratio for HAL is fluctuating over time, with an observable downward trajectory toward the latest data points, showing some instability in the company's ability to pay off its short-term liabilities. Here is a brief overview of the significant fluctuations:
- The current ratio was 2.14 on December 31, 2020.
- From that point, it increased slightly and reached 2.39 by September 30, 2021, indicating a slight improvement in the company's financial health.
- However, a downward trend started to emerge, reaching 2.05 by the end of 2022. This suggests a decline in the company's ability to meet its short-term obligations relative to its liquid assets.
- Starting from 2023, the current ratio seems to have stabilized somewhat, with minor fluctuations between 2.14 and 2.13. Still, these ratios are lower than the peak value observed in 2021.
Calculating the growth rate from the first value (2.14 on December 31, 2020) to the last (2.14 on September 30, 2023) results in a basically flat 0% growth rate. Given the emphasis on recent data, the drop in the current ratio from 2.19 in March 2022 to 2.05 in December 2022 is noteworthy.
This suggests a decrease in the company's short-term liquidity or an increase in short-term liabilities during this period. In conclusion, while there were periods of improvement, the overall trend for HAL's current ratio signals volatility and potential caution regarding the company's immediate financial health.
Understanding Halliburton's 2023 Share Price Fluctuations: Growth, Decline and Market Trends
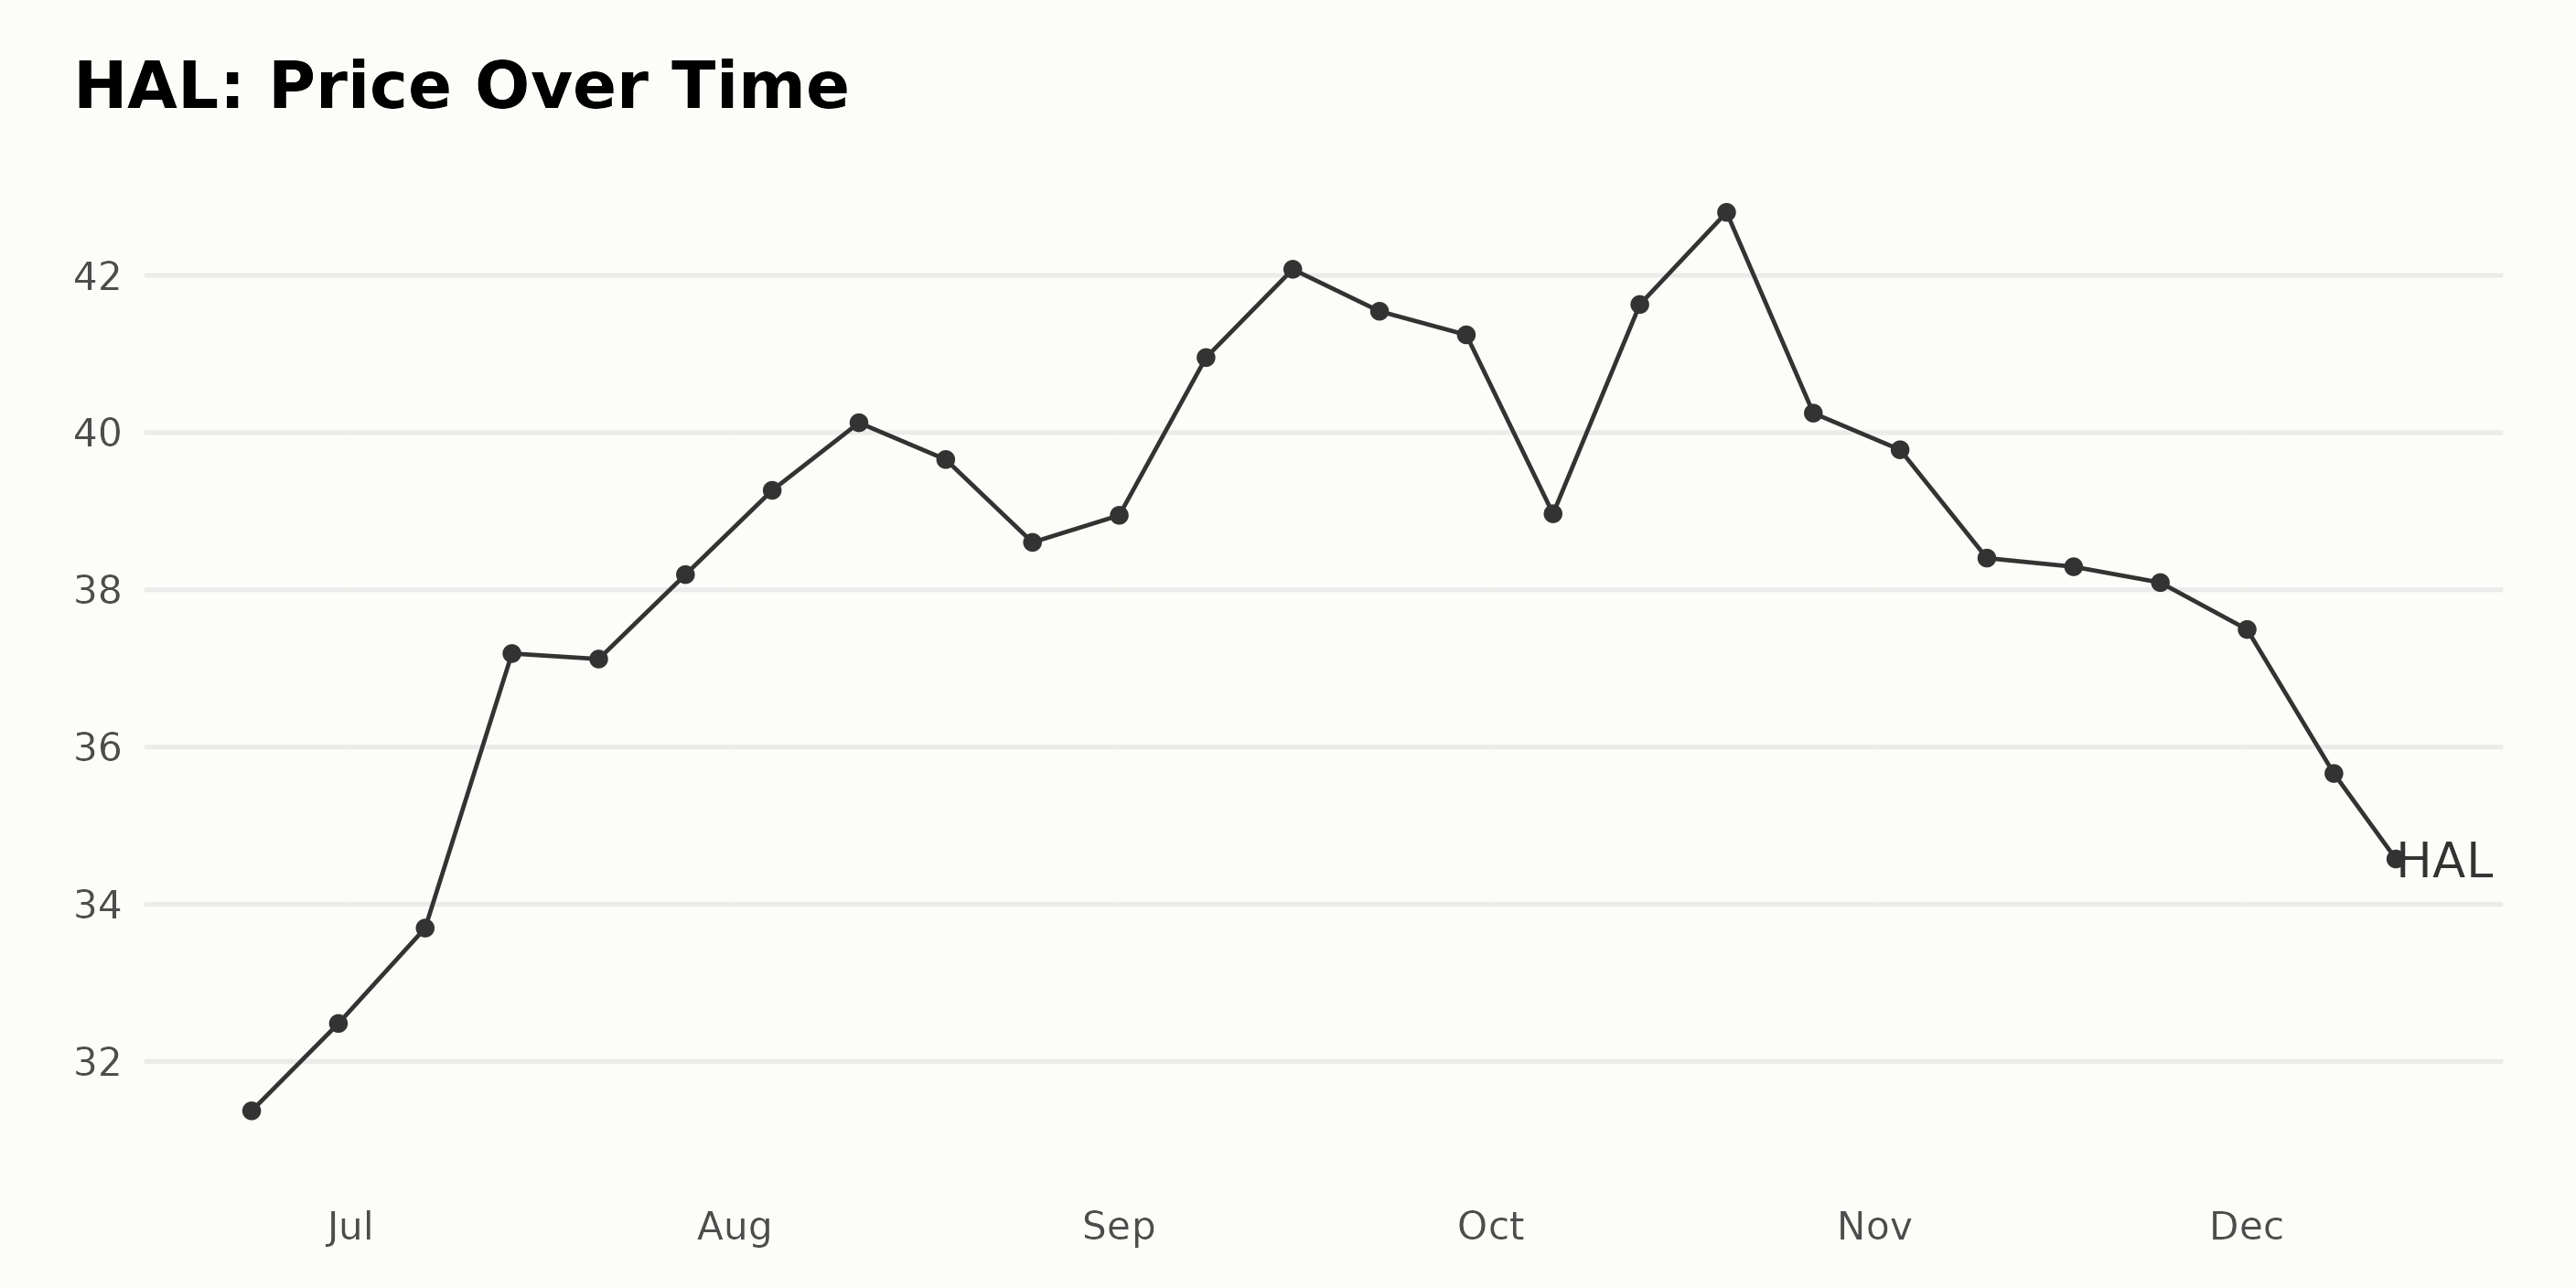
Analyzing the share price of HAL over the reported time period, the following trends are evident:
- The price shows an overall increase from June 2023 to September 2023, starting from a value of $31.37 on June 23, 2023, and climbing to $42.08 on September 15, 2023. This represents an uptrend, indicating a positive growth rate during these months.
- June and July 2023 witnessed the highest acceleration in growth with prices escalating from $31.37 to $38.19. The largest jump occurred between July 7 and July 14, when the value rose from $33.70 to $37.19.
- From late September 2023 onward, the trend began to decelerate. The share price declined from its high of $42.08 on September 15, 2023, ending at $34.58 by December 13, 2023. The most noteworthy decrease happened between October 27 ($40.25) and November 3 ($39.78).
- Despite intermittent increases, the overall trend from late September to December was a deceleration in growth. The company closed the last trading session at $34.69.
In conclusion, the share price demonstrated an increasing trend during the initial months, followed by a declining trend toward the end of the given timeframe. This sequence suggests a fluctuating market scenario for HAL during 2023. Here is a chart of HAL's price over the past 180 days.
Analyzing Halliburton's Performance: Growth, Momentum, and Quality Trends in 2023
The POWR Ratings grade of HAL, a stock in the Energy - Services category, has been fluctuating within the grades C (Neutral) and B (Buy) from June 2023 through December 2023. However, its rank in the category varied slightly during this period, but it demonstrated an improved position over time among the 49 total stocks in the category. Detailed Breakdown:
- In June 2023, HAL held a POWR grade of C (Neutral) with a rank of #22 in its category.
- The company maintained its grade C (Neutral) through July 2023 but improved its rank to #17 by the end of the month.
- Throughout August 2023, HAL's POWR grade remained a C (Neutral). However, its rank fluctuated between #19 and #21.
- In September 2023, HAL continued with a grade of C (Neutral), but its rank improved significantly to #15.
- In October 2023, its POWR grade showed some improvement, shifting to B (Buy) for some weeks but returning to C (Neutral). Also, its rank remained constant at #16 throughout the month.
- In November 2023, HAL's POWR grade continued fluctuating between B (Buy) and C (Neutral), while its rank improved to #15.
- As of December 14, 2023, HAL has a rank of #15, with its grade dropping to C (Neutral).
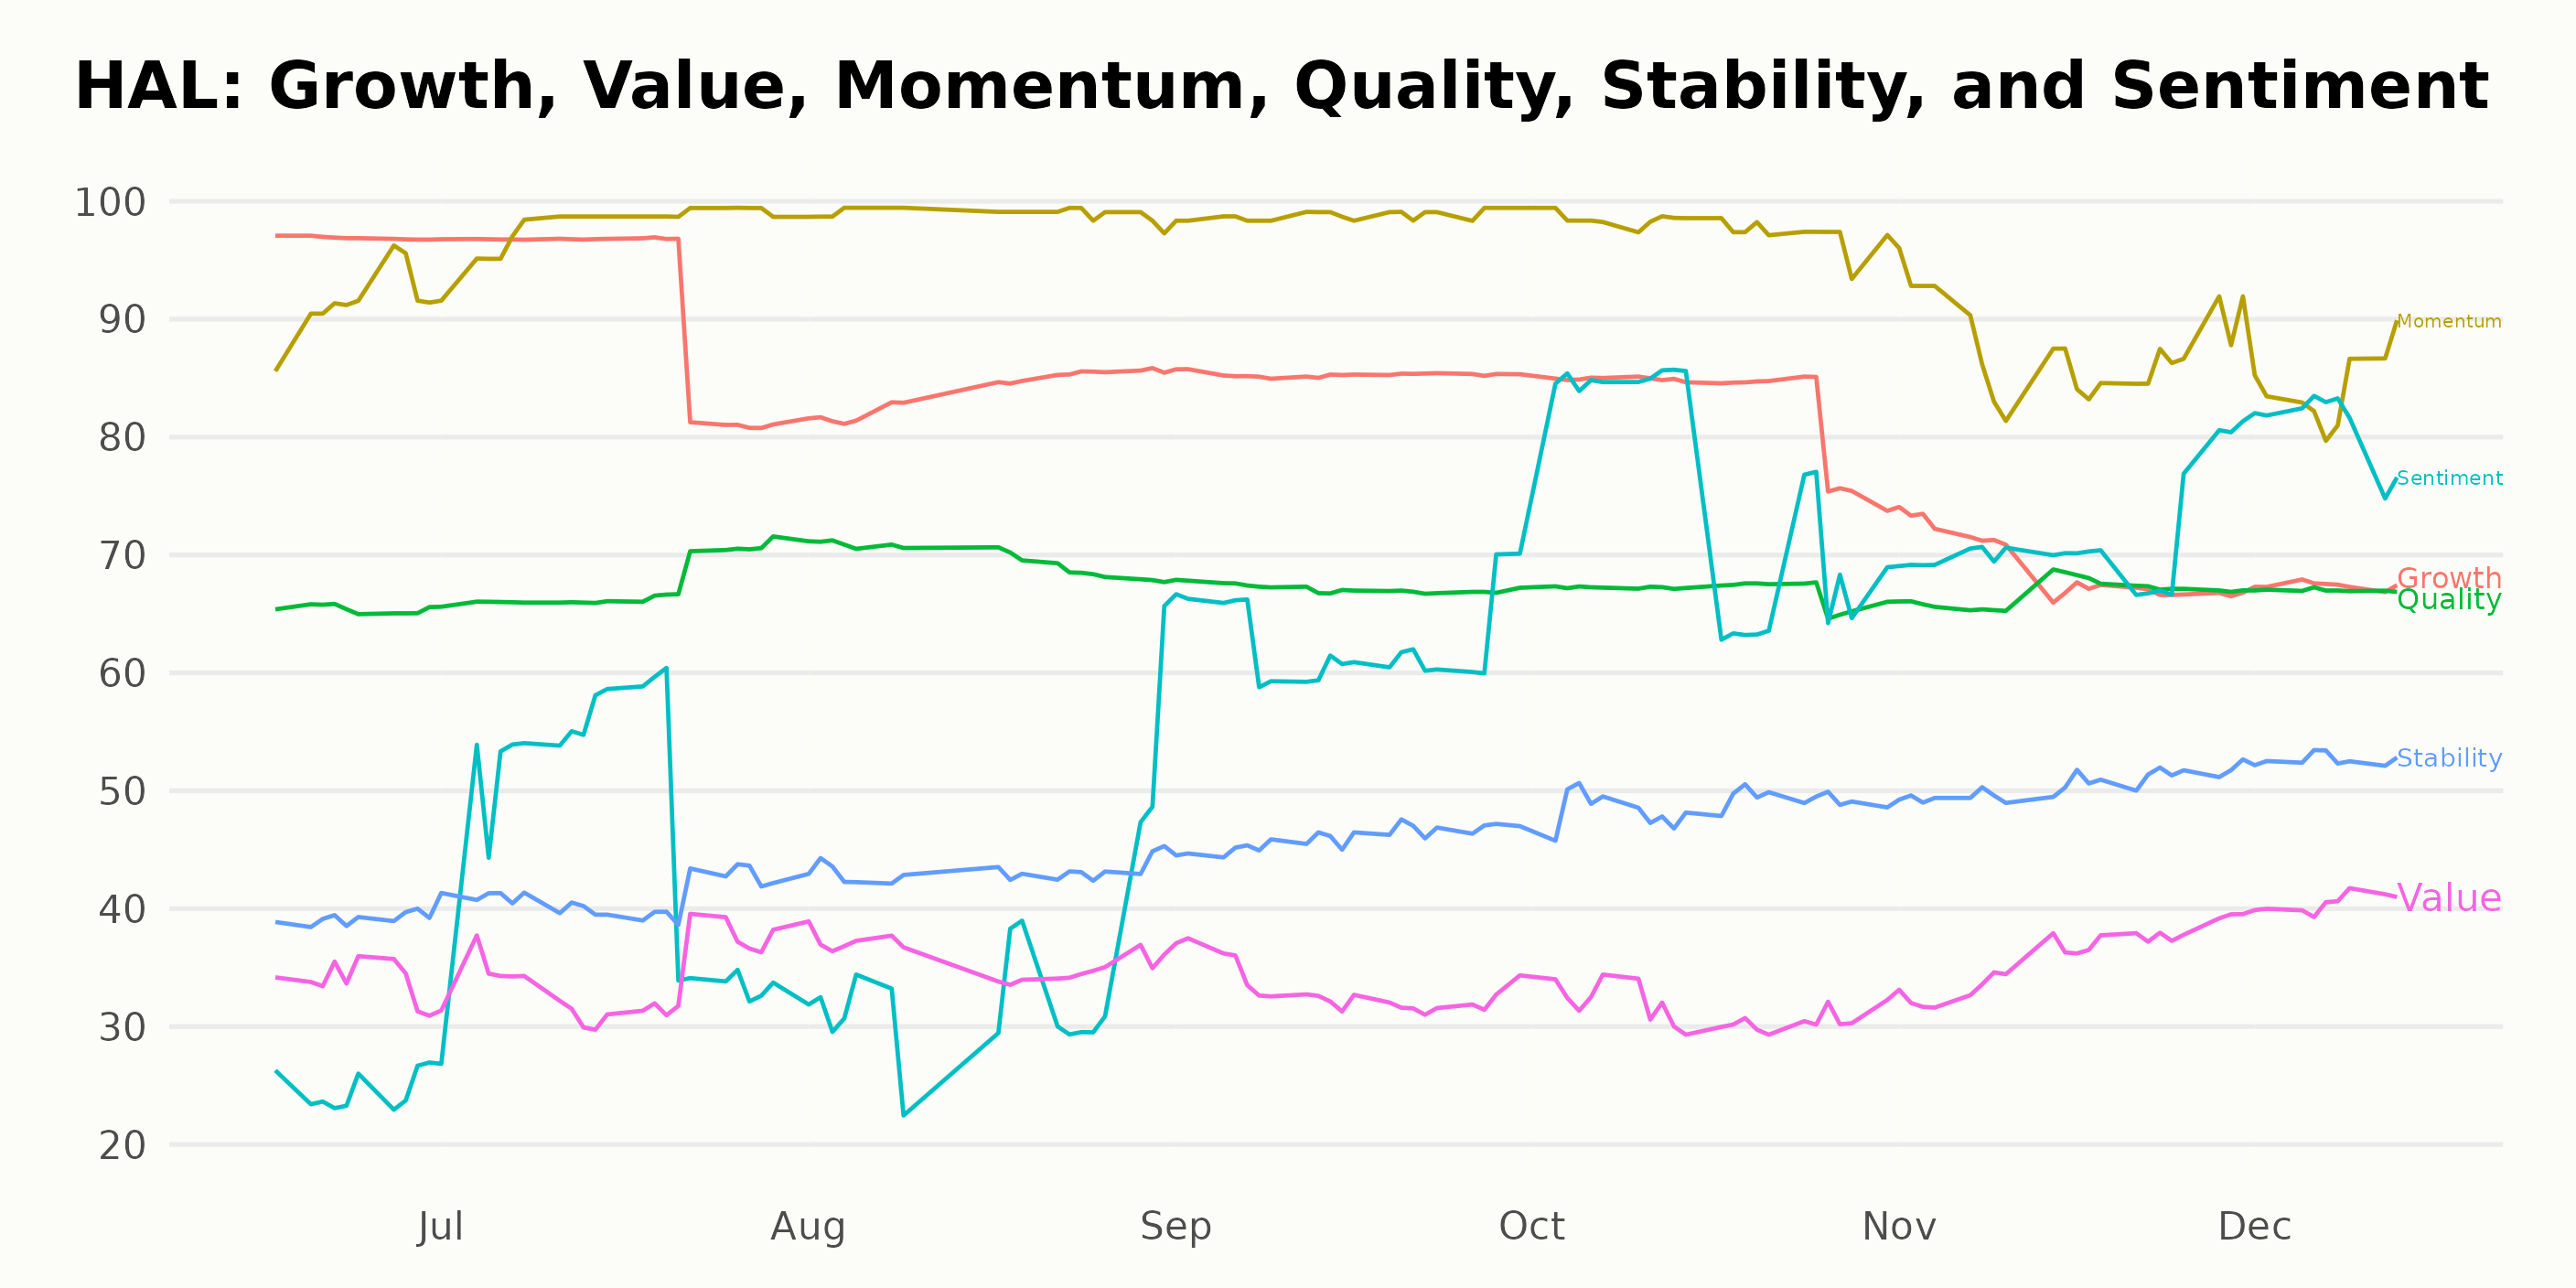
Based on the data provided, the three dimensions from the POWR Ratings for HAL that have proven to be most noteworthy are Growth, Momentum, and Quality. Here are the key details:
Growth: Started with an impressive rating of 97 in June 2023, denoting strong growth trends. However, there is a clear, gradual downward trend over the months, with this dimension's rating decreasing to 67 by December 13, 2023.
Momentum: This dimension consistently held high ratings throughout. Starting at 92 in June 2023, it peaked at 99 in both August and September 2023. Though there was a slight drop towards the end of the year, it still maintained an admirable score of 84 in December 2023.
Quality: Showed relatively consistent performance throughout the analyzed period. The rating for this dimension slightly increased from 65 in June to 67 in July 2023 and remained constant at 67 till the end of the year.
To summarize, while Growth and Momentum have garnered the highest ratings over time, they exhibit different trends. The Growth dimension showed a downward trend, whereas Momentum largely remained stable with a minor dip near year-end. On the other hand, the Quality dimension presented a more constant steady performance.
How does Halliburton Company (HAL) Stack Up Against its Peers?
Other stocks in the Energy - Services sector that may be worth considering are Vibra Energia S.A. (PETRY), Trican Well Service Ltd. (TOLWF), and Geospace Technologies Corporation (GEOS) - they have better POWR Ratings. Click here to explore more Energy - Services stocks.
What To Do Next?
43 year investment veteran, Steve Reitmeister, has just released his 2024 market outlook along with trading plan and top 11 picks for the year ahead.
HAL shares were trading at $35.62 per share on Thursday morning, up $0.93 (+2.68%). Year-to-date, HAL has declined -7.84%, versus a 24.92% rise in the benchmark S&P 500 index during the same period.
About the Author: Anushka Dutta

Anushka is an analyst whose interest in understanding the impact of broader economic changes on financial markets motivated her to pursue a career in investment research.
The post Halliburton's (HAL) Potential to Power Your Portfolio appeared first on StockNews.com