
Business management solutions provider Barrett Business Services (NASDAQ: BBSI) reported Q1 CY2025 results topping the market’s revenue expectations, with sales up 10.1% year on year to $292.6 million. Its GAAP loss of $0.04 per share was 68.6% above analysts’ consensus estimates.
Is now the time to buy Barrett? Find out by accessing our full research report, it’s free.
Barrett (BBSI) Q1 CY2025 Highlights:
- Revenue: $292.6 million vs analyst estimates of $285.9 million (10.1% year-on-year growth, 2.3% beat)
- EPS (GAAP): -$0.04 vs analyst estimates of -$0.13 (68.6% beat)
- Adjusted EBITDA: -$2.21 million vs analyst estimates of -$5.5 million (-0.8% margin, 59.7% beat)
- Operating Margin: -1.4%, in line with the same quarter last year
- Market Capitalization: $1.06 billion
“BBSI delivered a strong start to the year, highlighted by record gross and net WSE additions and continued high client retention,” said Gary Kramer, President and CEO of BBSI.
Company Overview
Operating as a professional employer organization (PEO) that serves over 8,000 companies with more than 120,000 worksite employees, Barrett Business Services (NASDAQ: BBSI) provides management solutions that help small and mid-sized businesses handle human resources, payroll, workers' compensation, and other administrative functions.
Sales Growth
Reviewing a company’s long-term sales performance reveals insights into its quality. Any business can put up a good quarter or two, but many enduring ones grow for years.
With $1.17 billion in revenue over the past 12 months, Barrett is a small player in the business services space, which sometimes brings disadvantages compared to larger competitors benefiting from economies of scale and numerous distribution channels. On the bright side, it can grow faster because it has more room to expand.
As you can see below, Barrett’s sales grew at a decent 5.2% compounded annual growth rate over the last five years. This shows its offerings generated slightly more demand than the average business services company, a helpful starting point for our analysis.
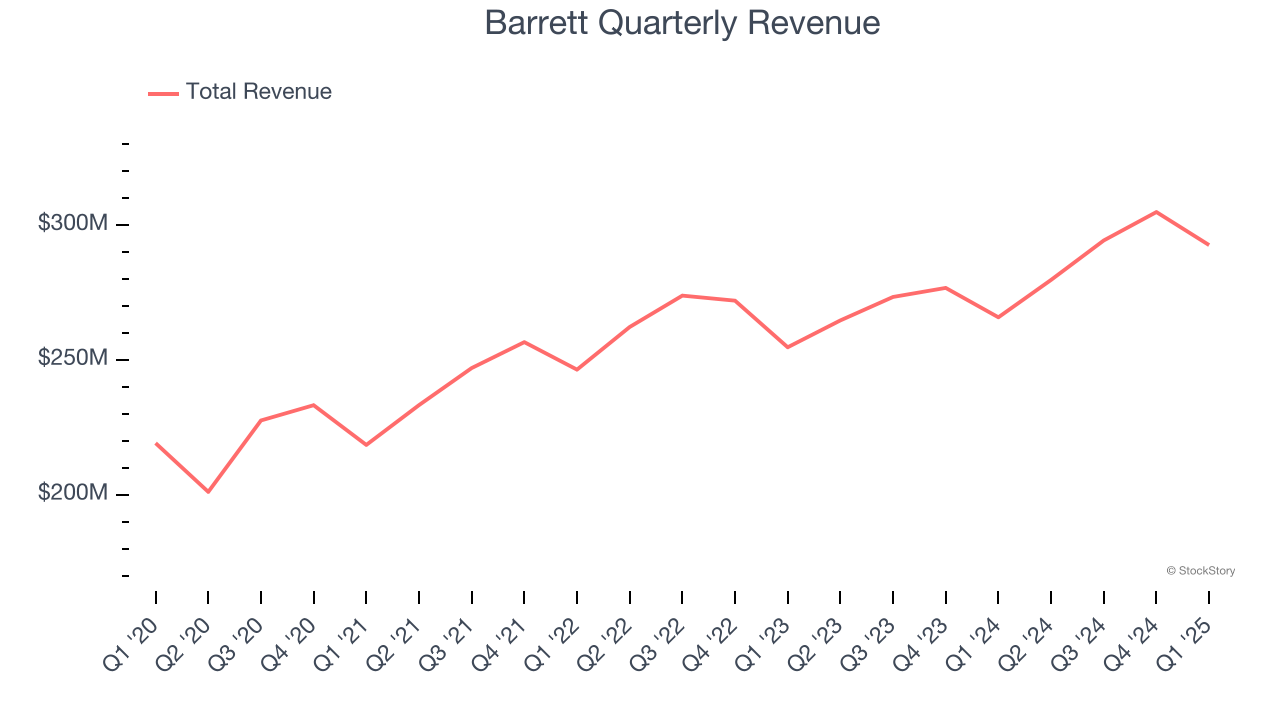
Long-term growth is the most important, but within business services, a half-decade historical view may miss new innovations or demand cycles. Barrett’s annualized revenue growth of 5% over the last two years aligns with its five-year trend, suggesting its demand was consistently weak. 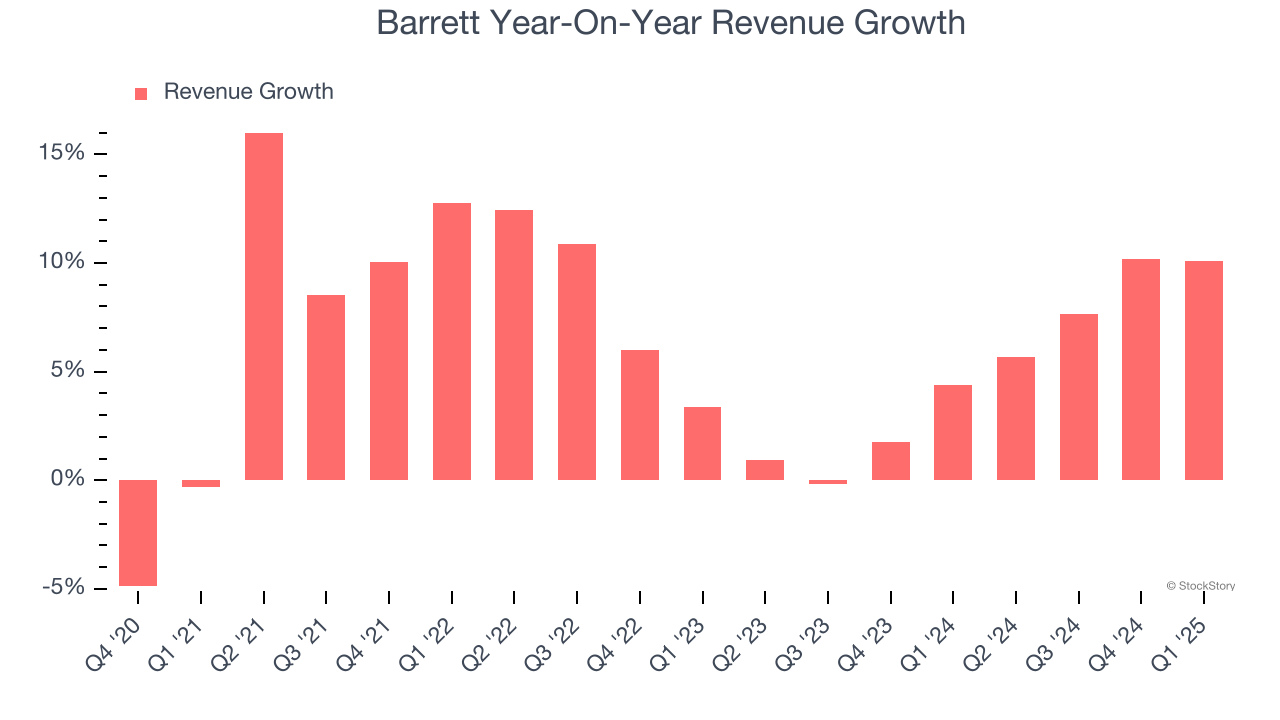
This quarter, Barrett reported year-on-year revenue growth of 10.1%, and its $292.6 million of revenue exceeded Wall Street’s estimates by 2.3%.
We also like to judge companies based on their projected revenue growth, but not enough Wall Street analysts cover the company for it to have reliable consensus estimates. This signals Barrett could be a hidden gem because it doesn’t get attention from professional brokers.
Software is eating the world and there is virtually no industry left that has been untouched by it. That drives increasing demand for tools helping software developers do their jobs, whether it be monitoring critical cloud infrastructure, integrating audio and video functionality, or ensuring smooth content streaming. Click here to access a free report on our 3 favorite stocks to play this generational megatrend.
Operating Margin
Operating margin is a key measure of profitability. Think of it as net income - the bottom line - excluding the impact of taxes and interest on debt, which are less connected to business fundamentals.
Barrett was profitable over the last five years but held back by its large cost base. Its average operating margin of 5.1% was weak for a business services business.
On the plus side, Barrett’s operating margin rose by 1.1 percentage points over the last five years, as its sales growth gave it operating leverage.
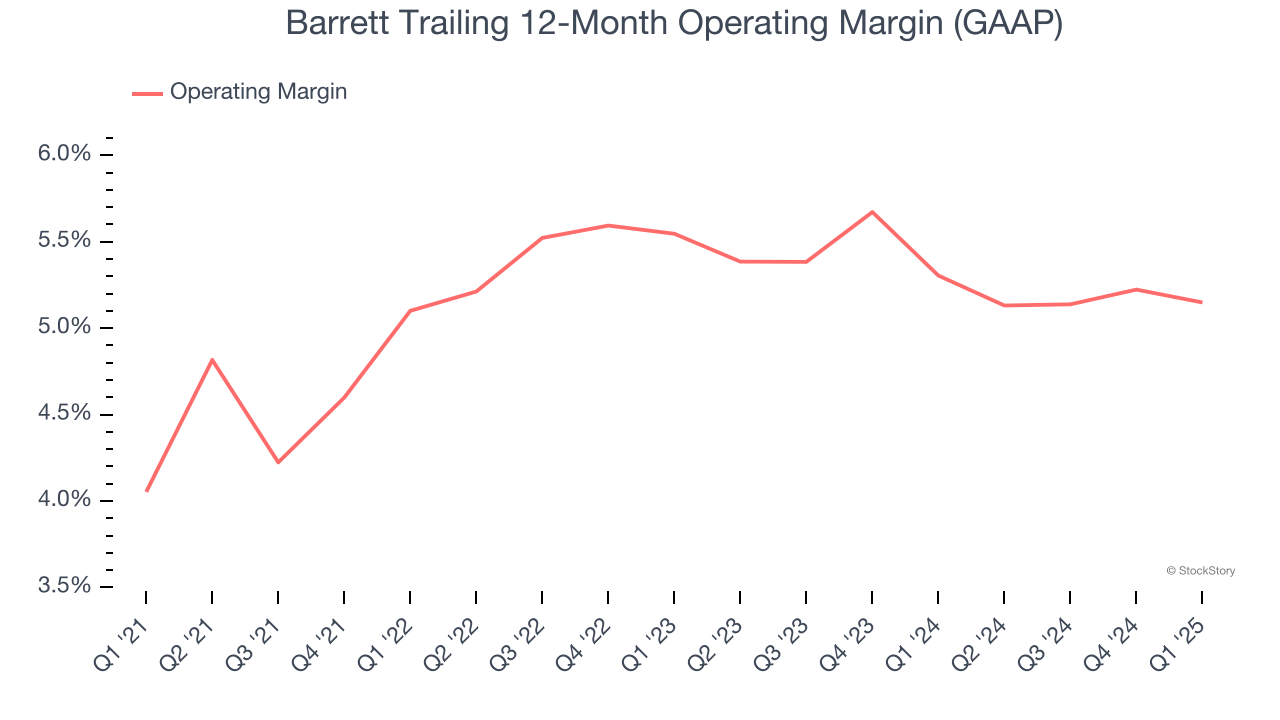
In Q1, Barrett generated an operating profit margin of negative 1.4%, in line with the same quarter last year. This indicates the company’s overall cost structure has been relatively stable.
Earnings Per Share
Revenue trends explain a company’s historical growth, but the long-term change in earnings per share (EPS) points to the profitability of that growth – for example, a company could inflate its sales through excessive spending on advertising and promotions.
Barrett’s unimpressive 5% annual EPS growth over the last five years aligns with its revenue performance. On the bright side, this tells us its incremental sales were profitable.
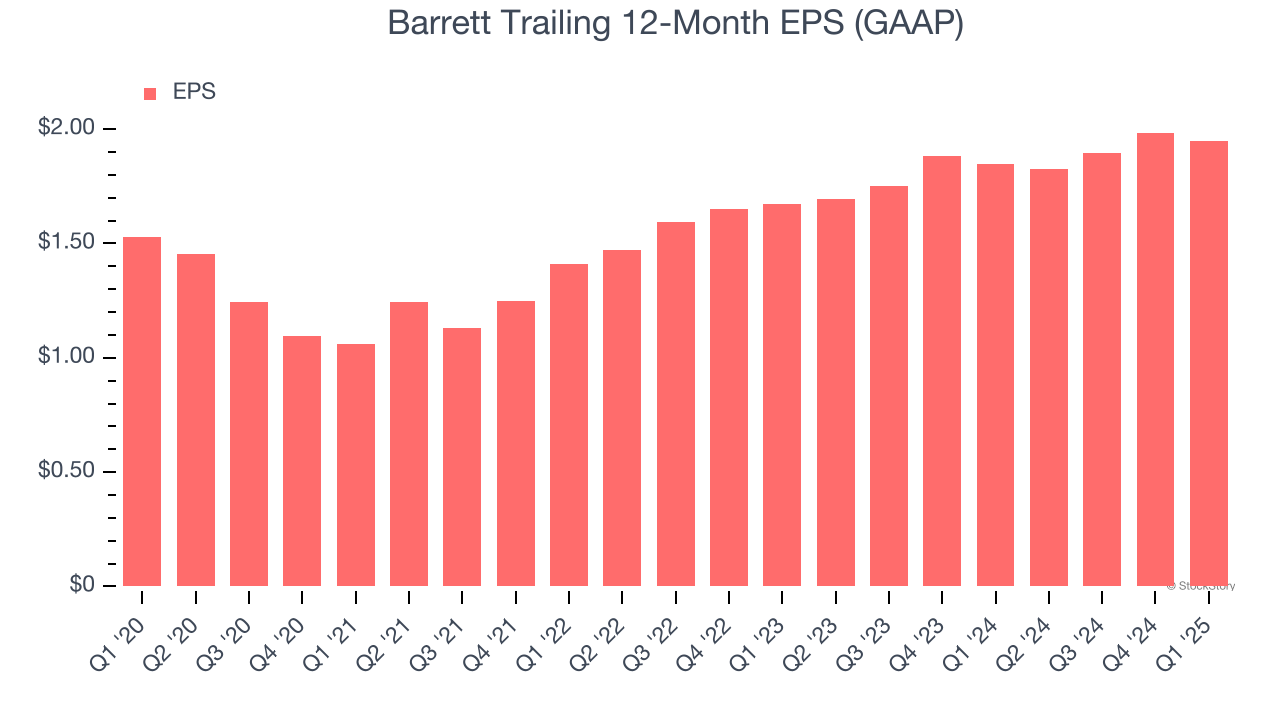
In Q1, Barrett reported EPS at negative $0.04, down from negative $0.01 in the same quarter last year. Despite falling year on year, this print easily cleared analysts’ estimates. Over the next 12 months, Wall Street expects Barrett’s full-year EPS of $1.95 to grow 16%.
Key Takeaways from Barrett’s Q1 Results
We were impressed by how significantly Barrett blew past analysts’ EPS expectations this quarter. We were also happy its revenue outperformed Wall Street’s estimates. Zooming out, we think this was a solid print. The stock remained flat at $40.77 immediately following the results.
So do we think Barrett is an attractive buy at the current price? The latest quarter does matter, but not nearly as much as longer-term fundamentals and valuation, when deciding if the stock is a buy. We cover that in our actionable full research report which you can read here, it’s free.