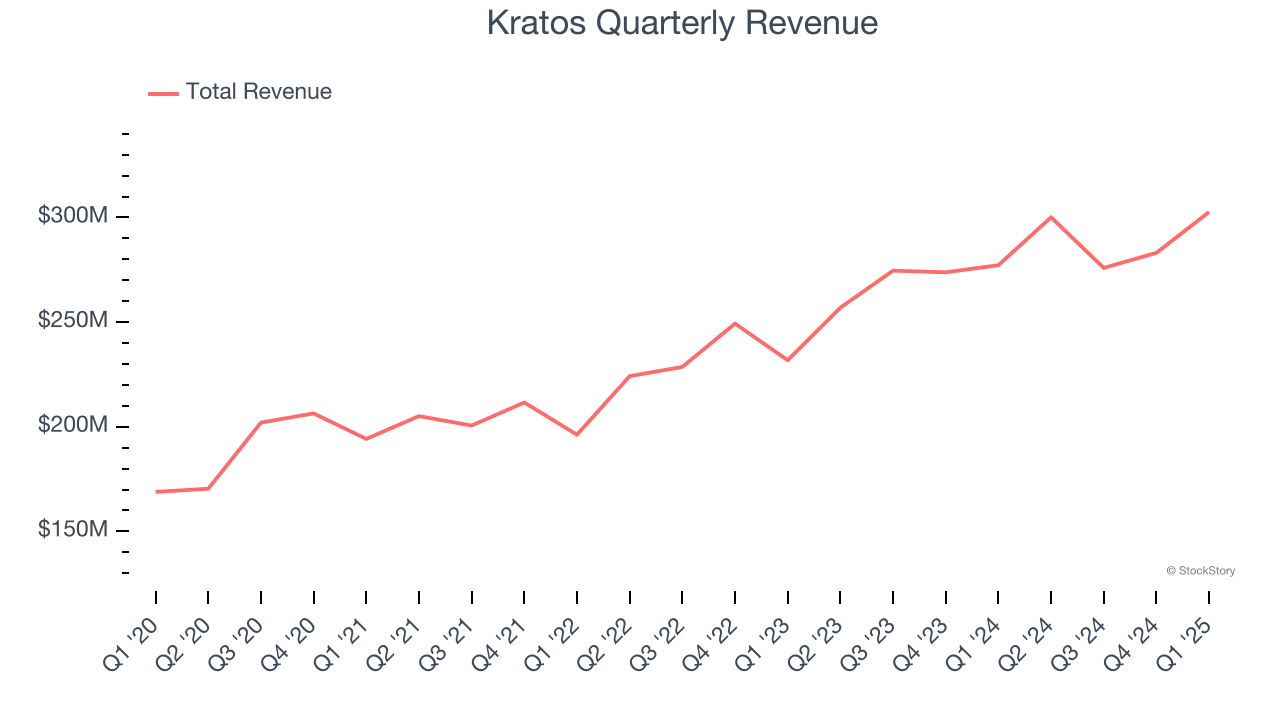
Aerospace and defense company Kratos (NASDAQ: KTOS) announced better-than-expected revenue in Q1 CY2025, with sales up 9.2% year on year to $302.6 million. On the other hand, next quarter’s revenue guidance of $305 million was less impressive, coming in 3.3% below analysts’ estimates. Its non-GAAP profit of $0.12 per share was 32.8% above analysts’ consensus estimates.
Is now the time to buy Kratos? Find out by accessing our full research report, it’s free.
Kratos (KTOS) Q1 CY2025 Highlights:
- Revenue: $302.6 million vs analyst estimates of $291.2 million (9.2% year-on-year growth, 3.9% beat)
- Adjusted EPS: $0.12 vs analyst estimates of $0.09 (32.8% beat)
- Adjusted EBITDA: $26.7 million vs analyst estimates of $23.12 million (8.8% margin, 15.5% beat)
- The company reconfirmed its revenue guidance for the full year of $1.27 billion at the midpoint
- EBITDA guidance for the full year is $115 million at the midpoint, below analyst estimates of $117.8 million
- Operating Margin: 2.2%, in line with the same quarter last year
- Free Cash Flow was -$51.8 million compared to -$15.9 million in the same quarter last year
- Organic Revenue rose 7.4% year on year (19.4% in the same quarter last year)
- Market Capitalization: $5.55 billion
Company Overview
Established with a commitment to supporting national security, Kratos (NASDAQ: KTOS) is a provider of advanced engineering, technology, and security solutions tailored for critical national security applications.
Sales Growth
Examining a company’s long-term performance can provide clues about its quality. Any business can experience short-term success, but top-performing ones enjoy sustained growth for years. Over the last five years, Kratos grew its sales at a solid 9.9% compounded annual growth rate. Its growth beat the average industrials company and shows its offerings resonate with customers.
Long-term growth is the most important, but within industrials, a half-decade historical view may miss new industry trends or demand cycles. Kratos’s annualized revenue growth of 11.5% over the last two years is above its five-year trend, suggesting its demand was strong and recently accelerated. 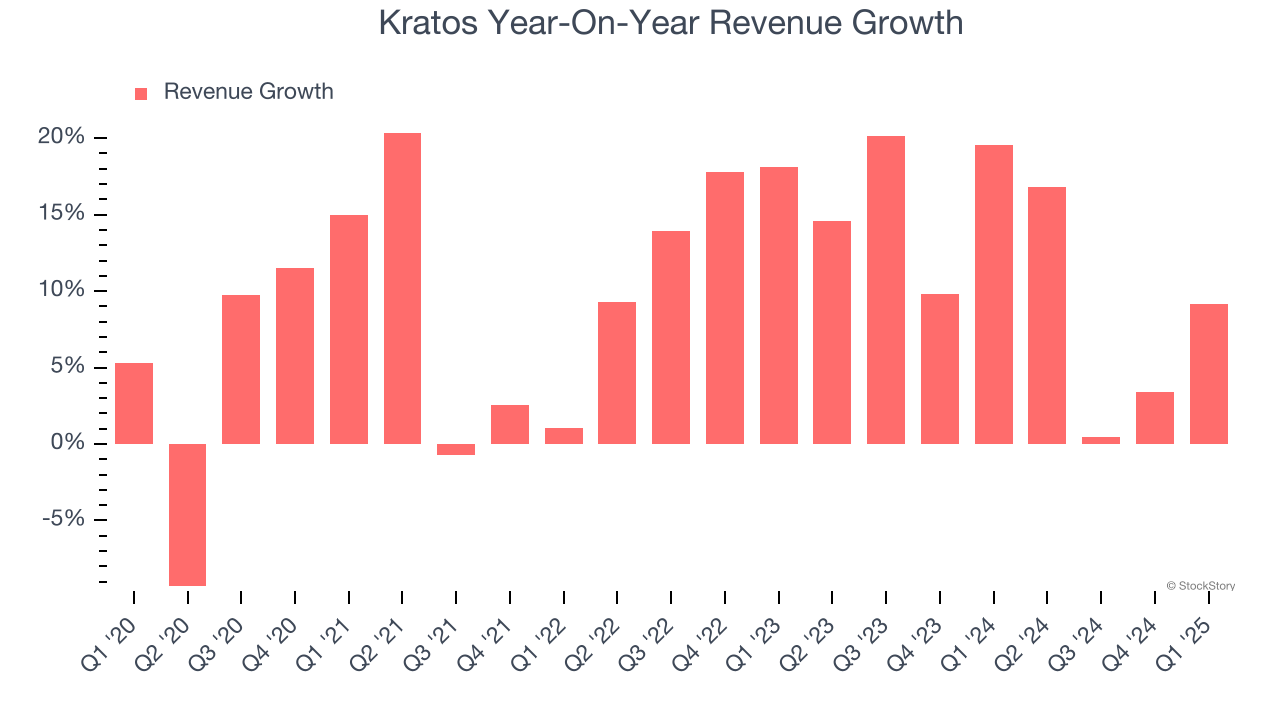
We can better understand the company’s sales dynamics by analyzing its organic revenue, which strips out one-time events like acquisitions and currency fluctuations that don’t accurately reflect its fundamentals. Over the last two years, Kratos’s organic revenue averaged 10.9% year-on-year growth. Because this number aligns with its normal revenue growth, we can see the company’s core operations (not acquisitions and divestitures) drove most of its results. 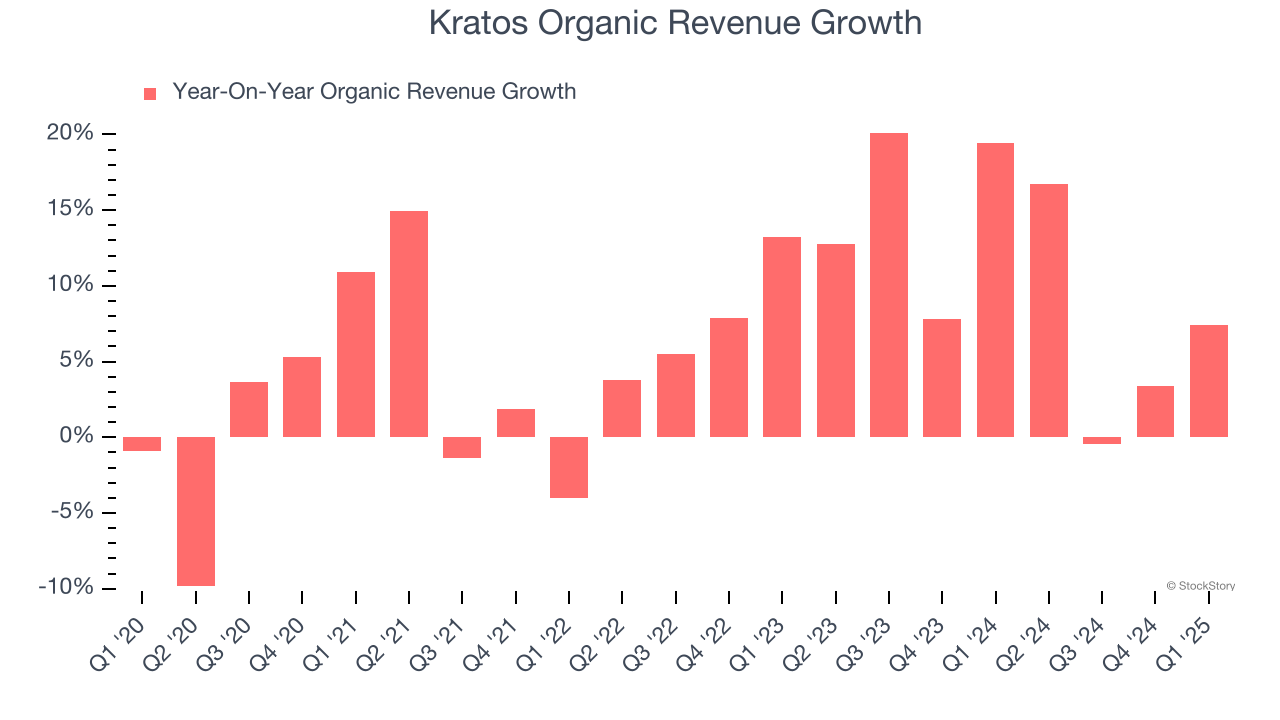
This quarter, Kratos reported year-on-year revenue growth of 9.2%, and its $302.6 million of revenue exceeded Wall Street’s estimates by 3.9%. Company management is currently guiding for a 1.6% year-on-year increase in sales next quarter.
Looking further ahead, sell-side analysts expect revenue to grow 13.7% over the next 12 months, an improvement versus the last two years. This projection is noteworthy and indicates its newer products and services will catalyze better top-line performance.
Today’s young investors won’t have read the timeless lessons in Gorilla Game: Picking Winners In High Technology because it was written more than 20 years ago when Microsoft and Apple were first establishing their supremacy. But if we apply the same principles, then enterprise software stocks leveraging their own generative AI capabilities may well be the Gorillas of the future. So, in that spirit, we are excited to present our Special Free Report on a profitable, fast-growing enterprise software stock that is already riding the automation wave and looking to catch the generative AI next.
Operating Margin
Kratos was profitable over the last five years but held back by its large cost base. Its average operating margin of 2.4% was weak for an industrials business.
Analyzing the trend in its profitability, Kratos’s operating margin decreased by 1.4 percentage points over the last five years. This raises questions about the company’s expense base because its revenue growth should have given it leverage on its fixed costs, resulting in better economies of scale and profitability. Kratos’s performance was poor no matter how you look at it - it shows that costs were rising and it couldn’t pass them onto its customers.
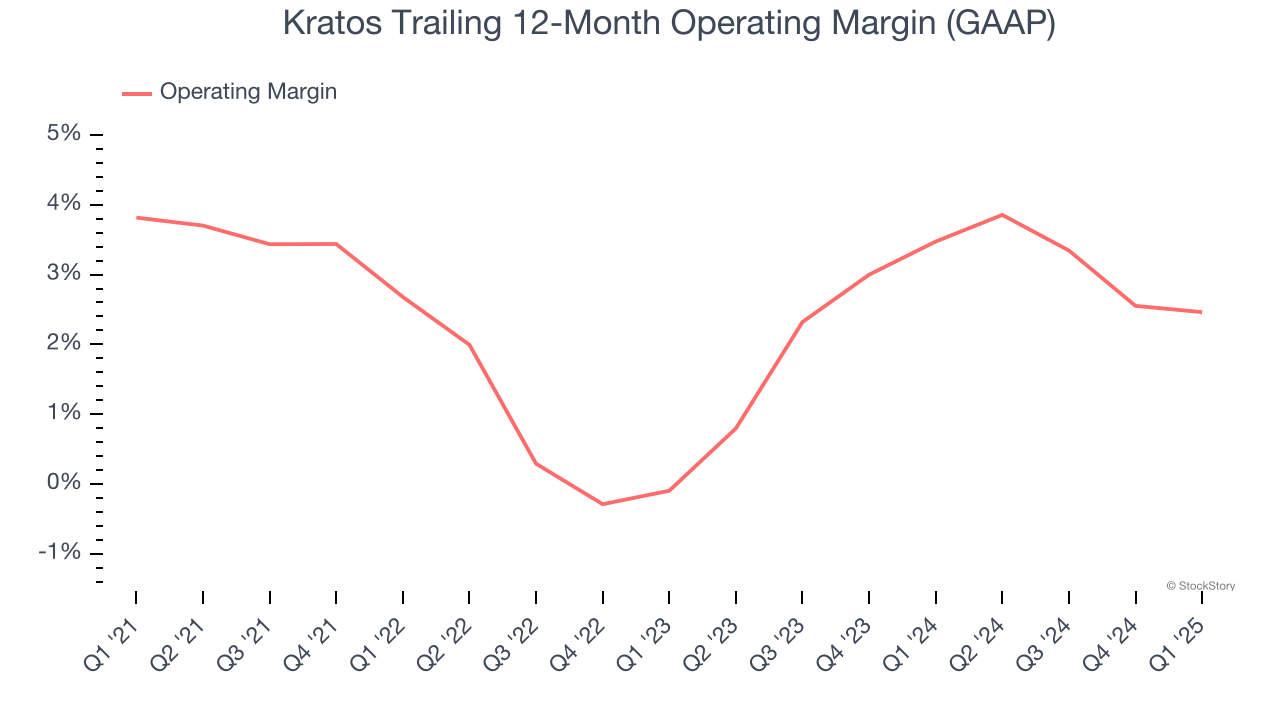
This quarter, Kratos generated an operating profit margin of 2.2%, in line with the same quarter last year. This indicates the company’s overall cost structure has been relatively stable.
Earnings Per Share
We track the long-term change in earnings per share (EPS) for the same reason as long-term revenue growth. Compared to revenue, however, EPS highlights whether a company’s growth is profitable.
Kratos’s EPS grew at an unimpressive 7.1% compounded annual growth rate over the last five years, lower than its 9.9% annualized revenue growth. This tells us the company became less profitable on a per-share basis as it expanded.
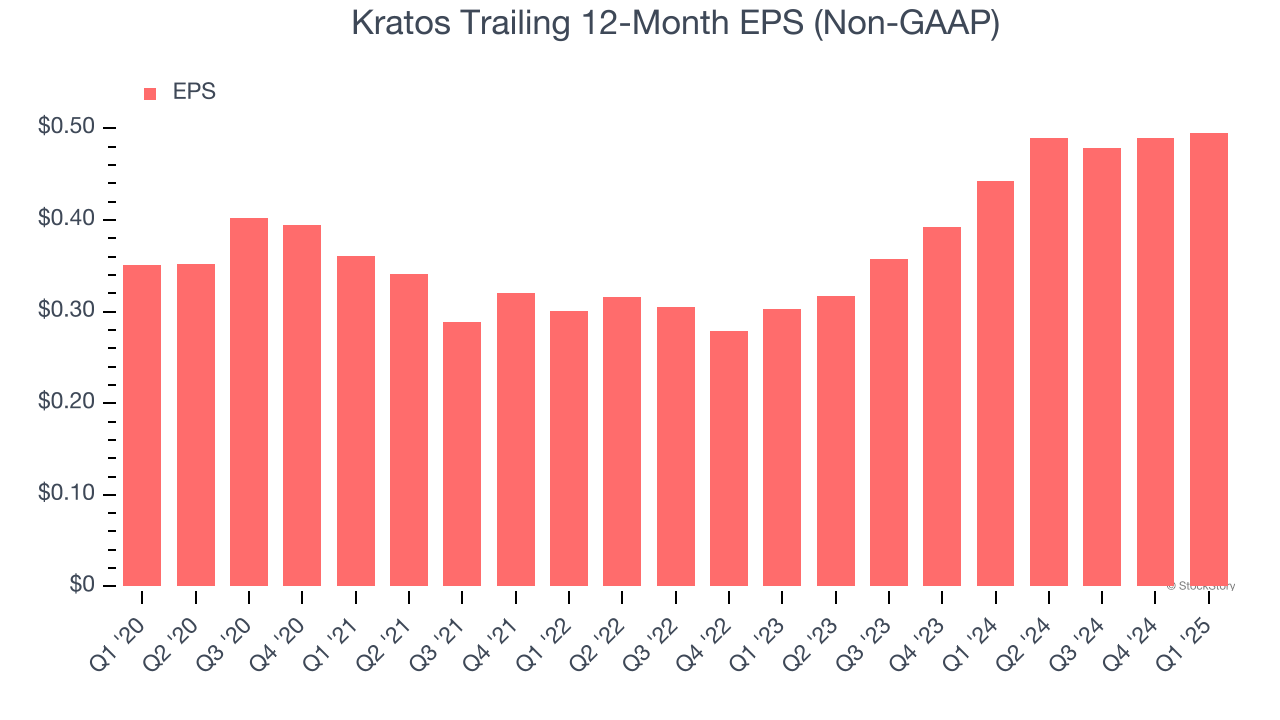
Diving into the nuances of Kratos’s earnings can give us a better understanding of its performance. As we mentioned earlier, Kratos’s operating margin was flat this quarter but declined by 1.4 percentage points over the last five years. Its share count also grew by 41.9%, meaning the company not only became less efficient with its operating expenses but also diluted its shareholders. 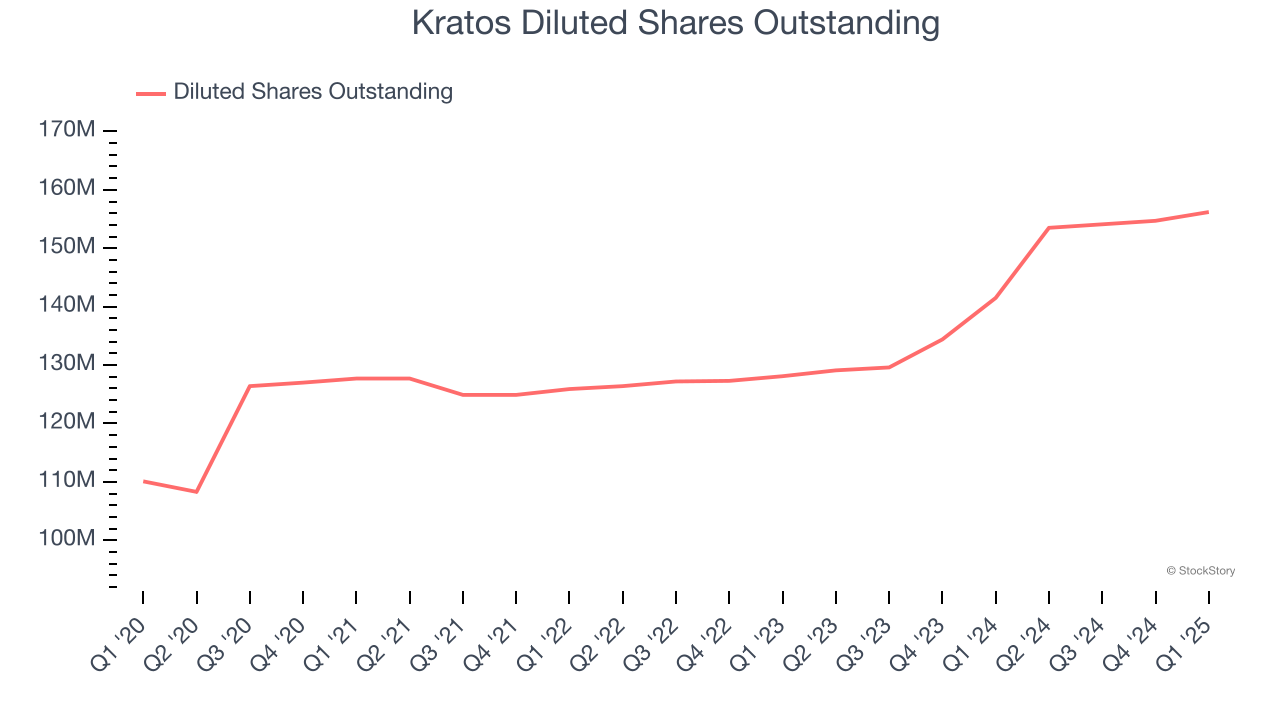
Like with revenue, we analyze EPS over a more recent period because it can provide insight into an emerging theme or development for the business.
For Kratos, its two-year annual EPS growth of 28% was higher than its five-year trend. This acceleration made it one of the faster-growing industrials companies in recent history.
In Q1, Kratos reported EPS at $0.12, in line with the same quarter last year. This print easily cleared analysts’ estimates, and shareholders should be content with the results. Over the next 12 months, Wall Street expects Kratos’s full-year EPS of $0.50 to grow 9.6%.
Key Takeaways from Kratos’s Q1 Results
We were impressed by how significantly Kratos blew past analysts’ organic revenue, EPS, and EBITDA expectations this quarter. On the other hand, its full-year EBITDA guidance fell short of Wall Street’s estimates. Overall, this print was mixed but still had some key positives. The stock remained flat at $35.80 immediately following the results.
Should you buy the stock or not? What happened in the latest quarter matters, but not as much as longer-term business quality and valuation, when deciding whether to invest in this stock. We cover that in our actionable full research report which you can read here, it’s free.