Media broadcasting company Sinclair (NASDAQ: SBGI) met Wall Street’s revenue expectations in Q1 CY2025, but sales fell by 2.8% year on year to $776 million. The company’s full-year revenue guidance of $797 billion at the midpoint came in 25,104% above analysts’ estimates. Its GAAP loss of $2.30 per share was significantly below analysts’ consensus estimates.
Is now the time to buy Sinclair? Find out by accessing our full research report, it’s free.
Sinclair (SBGI) Q1 CY2025 Highlights:
- Revenue: $776 million vs analyst estimates of $774.3 million (2.8% year-on-year decline, in line)
- EPS (GAAP): -$2.30 vs analyst estimates of -$0.91 (significant miss)
- Adjusted EBITDA: $112 million vs analyst estimates of $101.8 million (14.4% margin, 10% beat)
- EBITDA guidance for Q2 CY2025 is $99 million at the midpoint, below analyst estimates of $109.7 million
- Operating Margin: 1.8%, down from 5.3% in the same quarter last year
- Market Capitalization: $1.08 billion
"Sinclair delivered solid financial results in a challenging first quarter environment. Adjusted EBITDA exceeded the high-end of our guidance range and core advertising trends continue to be among the strongest in the industry, despite the macro-economic uncertainties and lack of visibility. We are seeing some signs of improvement in the pay TV ecosystem as consumers respond to innovative packaging," said Chris Ripley, Sinclair's President and Chief Executive Officer.
Company Overview
With over 2,400 hours of local news produced weekly and 640 broadcast channels reaching millions of American homes, Sinclair (NASDAQ: SBGI) operates a network of 185 local television stations across 86 U.S. markets, producing news programming and distributing content from major networks.
Sales Growth
A company’s long-term sales performance is one signal of its overall quality. Any business can put up a good quarter or two, but many enduring ones grow for years.
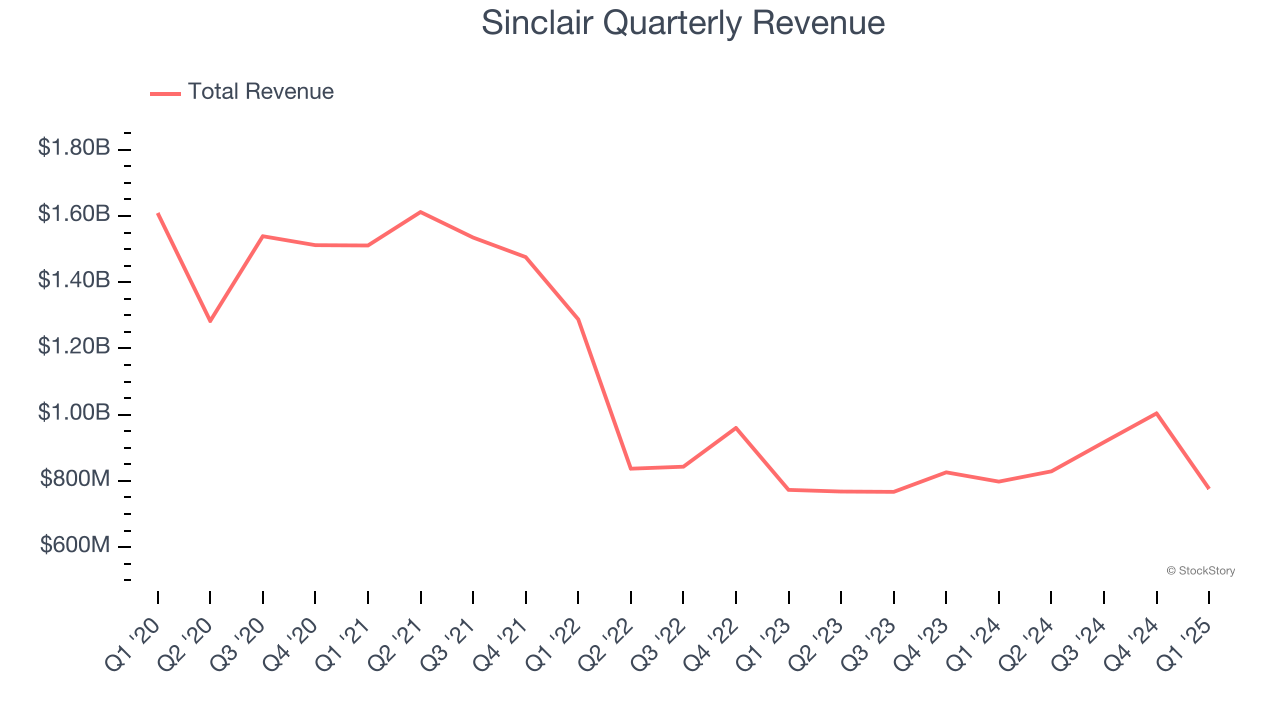
With $3.53 billion in revenue over the past 12 months, Sinclair is a mid-sized business services company, which sometimes brings disadvantages compared to larger competitors benefiting from better economies of scale.
As you can see below, Sinclair’s demand was weak over the last five years. Its sales fell by 7.2% annually, a poor baseline for our analysis.
We at StockStory place the most emphasis on long-term growth, but within business services, a half-decade historical view may miss recent innovations or disruptive industry trends. Sinclair’s annualized revenue growth of 1.6% over the last two years is above its five-year trend, but we were still disappointed by the results. 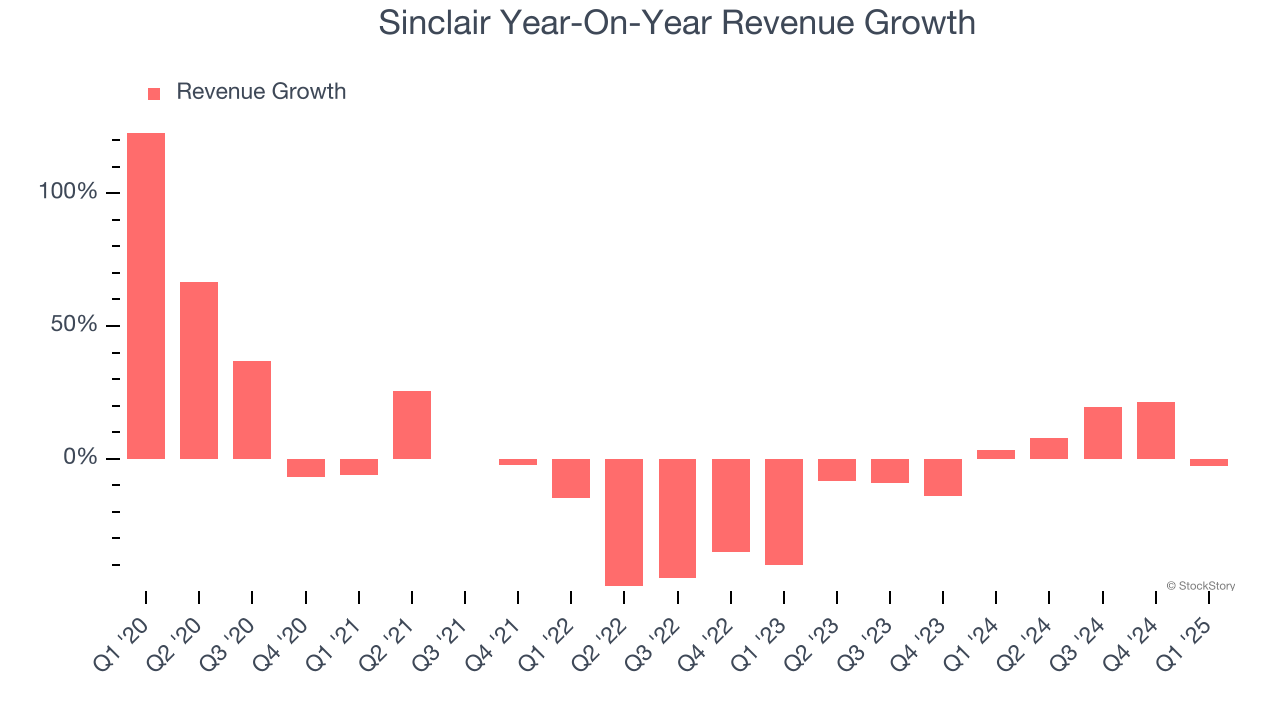
We can better understand the company’s revenue dynamics by analyzing its most important segments, Distribution and Advertising, which are 56.2% and 38.3% of revenue. Over the last two years, Sinclair’s Distribution revenue (content distribution) averaged 1.5% year-on-year growth while its Advertising revenue (advertising sales) averaged 4.2% growth.
This quarter, Sinclair reported a rather uninspiring 2.8% year-on-year revenue decline to $776 million of revenue, in line with Wall Street’s estimates.
Looking ahead, sell-side analysts expect revenue to decline by 10.5% over the next 12 months, a deceleration versus the last two years. This projection doesn't excite us and indicates its products and services will face some demand challenges.
Today’s young investors won’t have read the timeless lessons in Gorilla Game: Picking Winners In High Technology because it was written more than 20 years ago when Microsoft and Apple were first establishing their supremacy. But if we apply the same principles, then enterprise software stocks leveraging their own generative AI capabilities may well be the Gorillas of the future. So, in that spirit, we are excited to present our Special Free Report on a profitable, fast-growing enterprise software stock that is already riding the automation wave and looking to catch the generative AI next.
Operating Margin
Operating margin is an important measure of profitability as it shows the portion of revenue left after accounting for all core expenses – everything from the cost of goods sold to advertising and wages. It’s also useful for comparing profitability across companies with different levels of debt and tax rates because it excludes interest and taxes.
Sinclair was profitable over the last five years but held back by its large cost base. Its average operating margin of 5.5% was weak for a business services business.
On the plus side, Sinclair’s operating margin rose by 67.3 percentage points over the last five years.
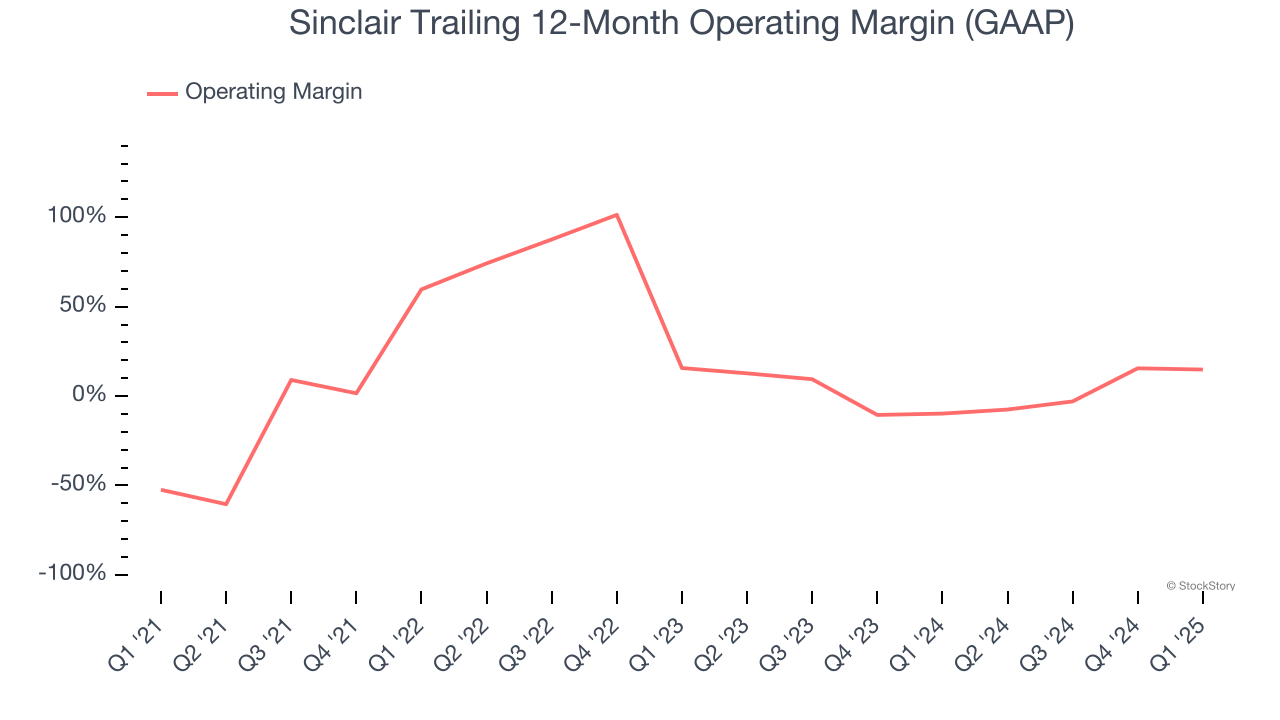
This quarter, Sinclair generated an operating profit margin of 1.8%, down 3.5 percentage points year on year. This contraction shows it was less efficient because its expenses increased relative to its revenue.
Earnings Per Share
We track the long-term change in earnings per share (EPS) for the same reason as long-term revenue growth. Compared to revenue, however, EPS highlights whether a company’s growth is profitable.
Sinclair’s EPS grew at an unimpressive 4.4% compounded annual growth rate over the last five years. On the bright side, this performance was better than its 7.2% annualized revenue declines and tells us management adapted its cost structure in response to a challenging demand environment.
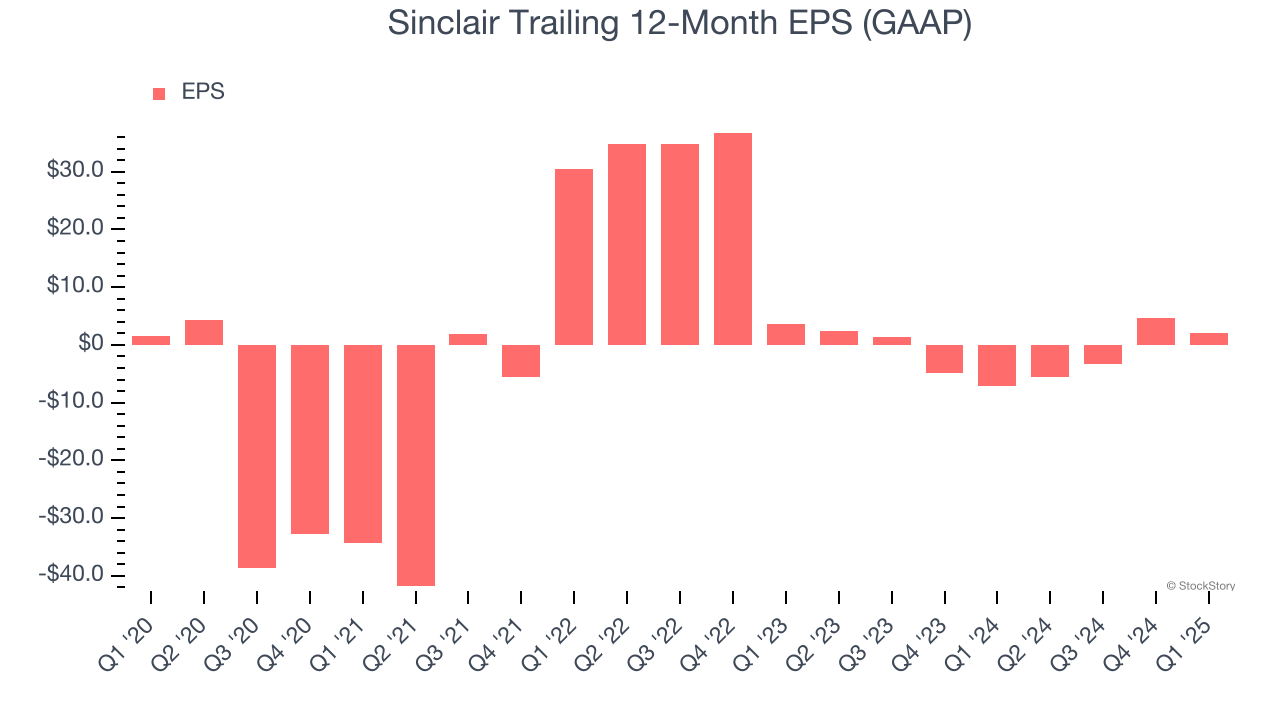
Diving into the nuances of Sinclair’s earnings can give us a better understanding of its performance. As we mentioned earlier, Sinclair’s operating margin declined this quarter but expanded by 67.3 percentage points over the last five years. Its share count also shrank by 26%, and these factors together are positive signs for shareholders because improving profitability and share buybacks turbocharge EPS growth relative to revenue growth. 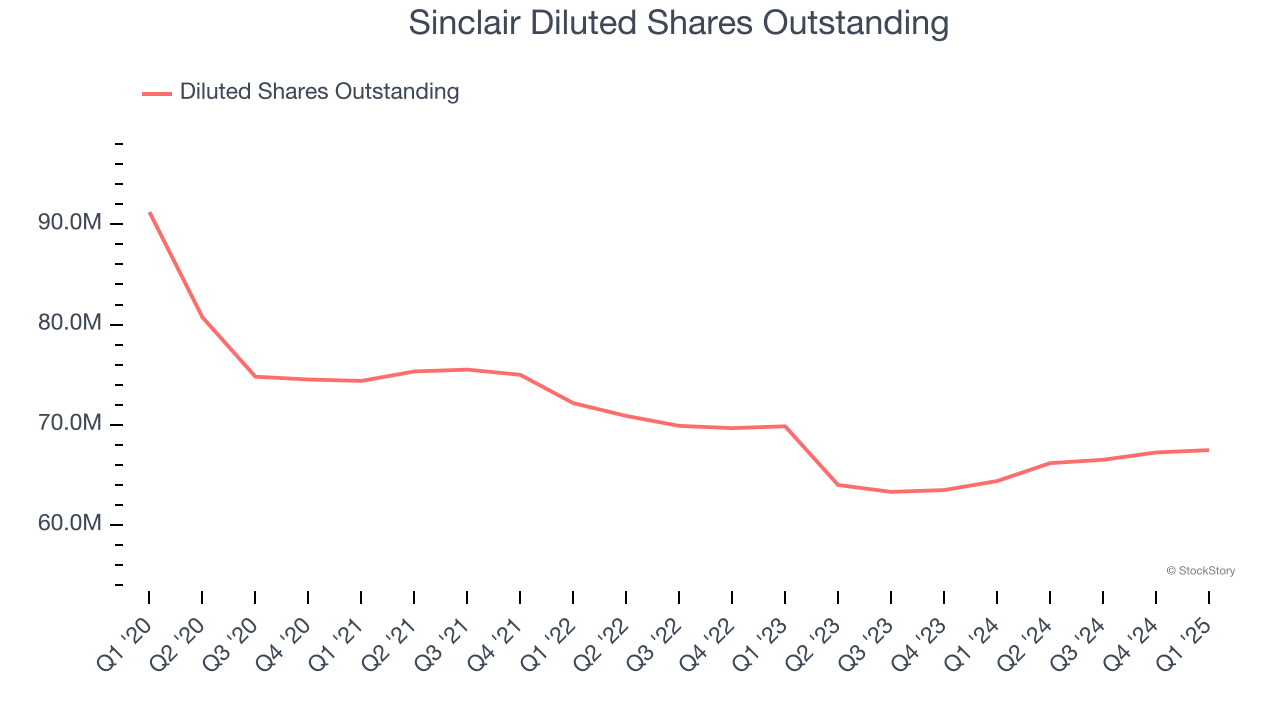
In Q1, Sinclair reported EPS at negative $2.30, down from $0.35 in the same quarter last year. This print missed analysts’ estimates. We also like to analyze expected EPS growth based on Wall Street analysts’ consensus projections, but there is insufficient data.
Key Takeaways from Sinclair’s Q1 Results
It was tough to see Sinclair's EPS and EBITDA missed significantly. Its EBITDA guidance for next quarter also fell short of expectations. Overall, this quarter could have been better. The stock traded down 7.6% to $14.50 immediately following the results.
Is Sinclair an attractive investment opportunity right now? We think that the latest quarter is only one piece of the longer-term business quality puzzle. Quality, when combined with valuation, can help determine if the stock is a buy. We cover that in our actionable full research report which you can read here, it’s free.