
Clothing company Hanesbrands (NYSE: HBI) met Wall Street’s revenue expectations in Q1 CY2025, with sales up 2.1% year on year to $760.1 million. On the other hand, next quarter’s revenue guidance of $970 million was less impressive, coming in 0.6% below analysts’ estimates. Its non-GAAP profit of $0.18 per share was significantly above analysts’ consensus estimates.
Is now the time to buy Hanesbrands? Find out by accessing our full research report, it’s free.
Hanesbrands (HBI) Q1 CY2025 Highlights:
- Revenue: $760.1 million vs analyst estimates of $756.7 million (2.1% year-on-year growth, in line)
- Adjusted EPS: $0.18 vs analyst estimates of $0.02 (significant beat)
- The company reconfirmed its revenue guidance for the full year of $3.50 billion at the midpoint
- Management reiterated its full-year Adjusted EPS guidance of $0.53 at the midpoint
- Free Cash Flow was -$119.4 million, down from $5.91 million in the same quarter last year
- Constant Currency Revenue rose 3.7% year on year (-15.7% in the same quarter last year)
- Market Capitalization: $1.73 billion
“We delivered another strong quarter, including revenue, operating profit and earnings per share that exceeded our expectations as we continue to see the benefits of our growth strategy and prior transformation initiatives,” said Steve Bratspies, CEO.
Company Overview
A classic American staple founded in 1901, Hanesbrands (NYSE: HBI) is a clothing company known for its array of basic apparel including innerwear and activewear.
Sales Growth
A company’s long-term sales performance is one signal of its overall quality. Any business can have short-term success, but a top-tier one grows for years. Over the last five years, Hanesbrands’s demand was weak and its revenue declined by 11.8% per year. This was below our standards and suggests it’s a low quality business.
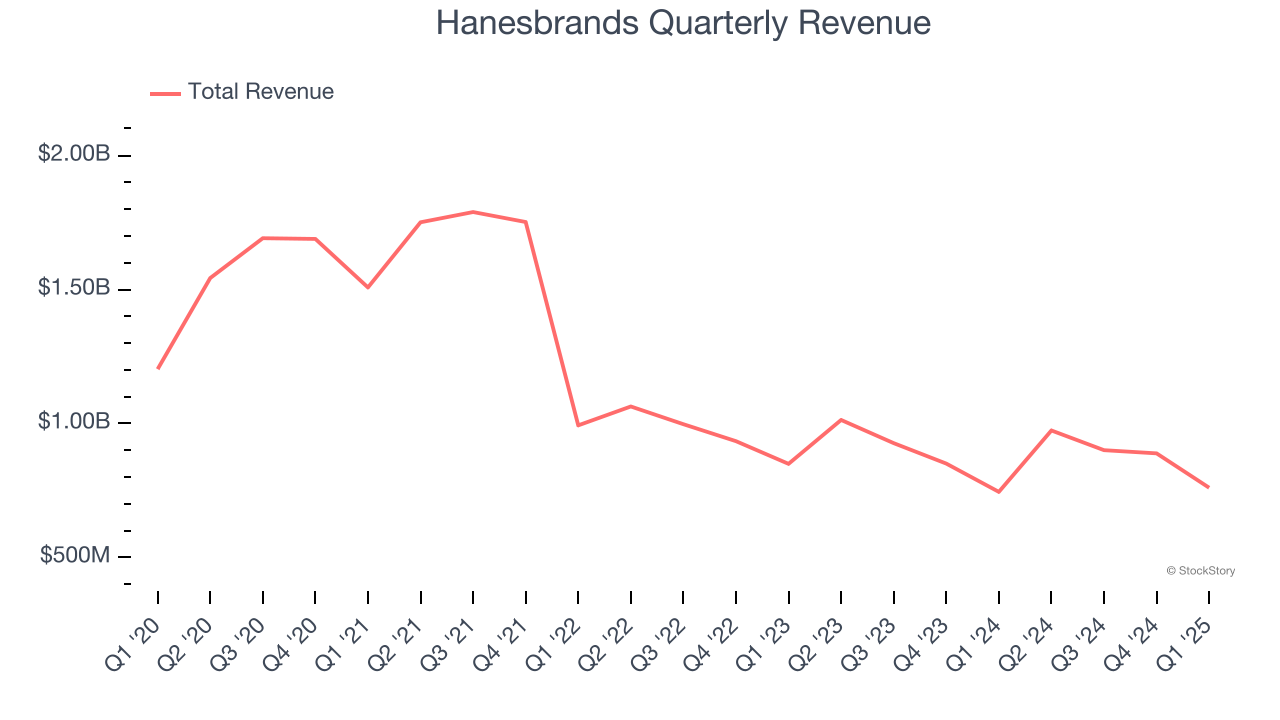
Long-term growth is the most important, but within consumer discretionary, product cycles are short and revenue can be hit-driven due to rapidly changing trends and consumer preferences. Hanesbrands’s annualized revenue declines of 4.3% over the last two years suggest its demand continued shrinking. 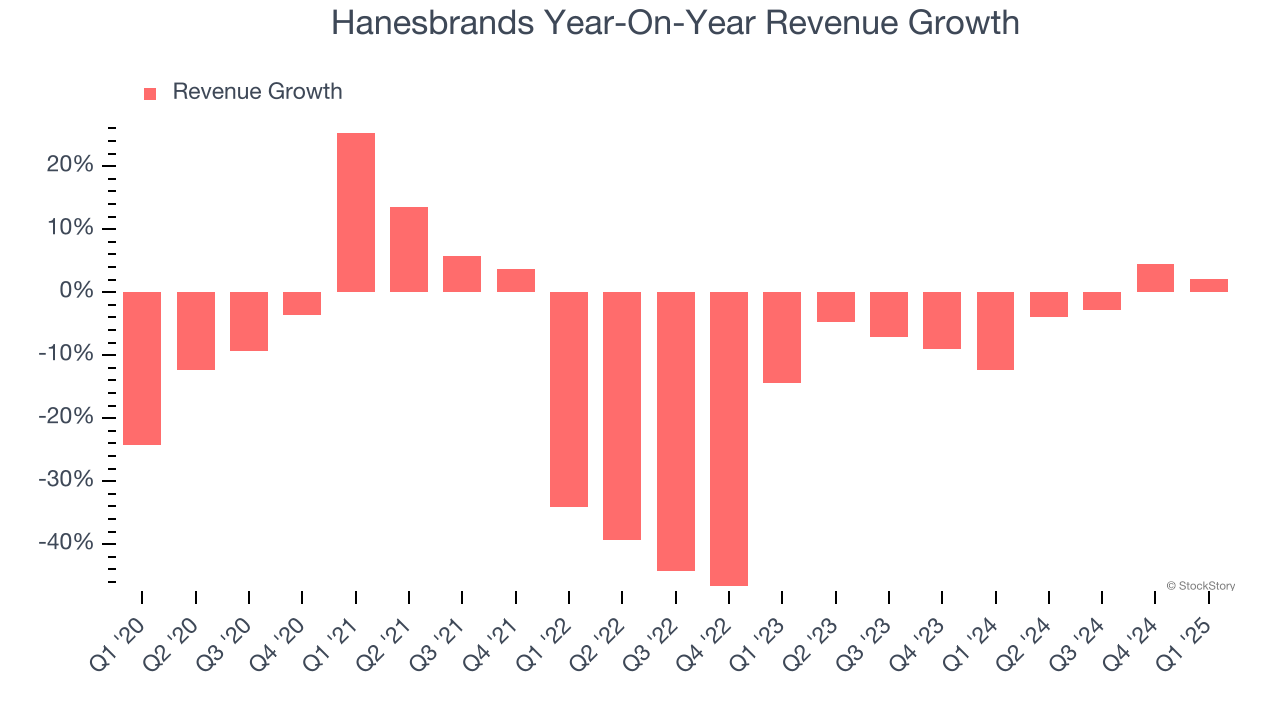
We can dig further into the company’s sales dynamics by analyzing its constant currency revenue, which excludes currency movements that are outside their control and not indicative of demand. Over the last two years, its constant currency sales averaged 4.4% year-on-year declines. Because this number aligns with its normal revenue growth, we can see that Hanesbrands has properly hedged its foreign currency exposure. 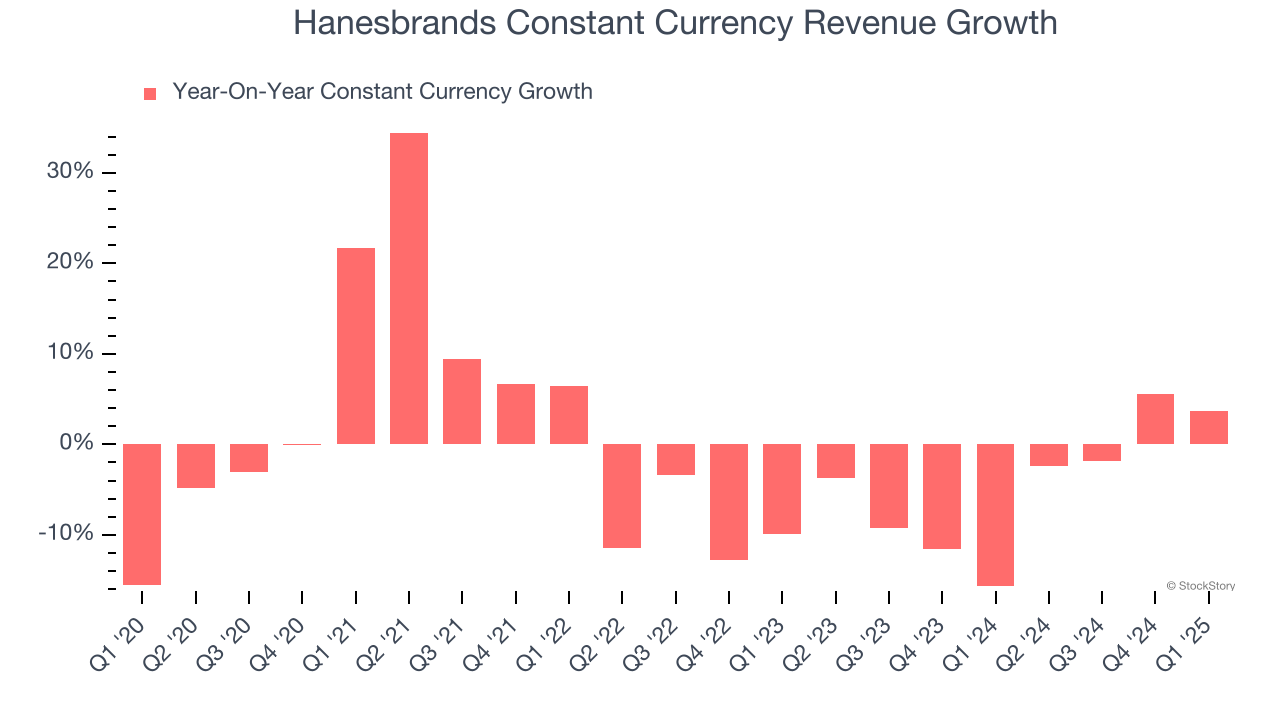
This quarter, Hanesbrands grew its revenue by 2.1% year on year, and its $760.1 million of revenue was in line with Wall Street’s estimates. Company management is currently guiding for flat sales next quarter.
Looking further ahead, sell-side analysts expect revenue to remain flat over the next 12 months. Although this projection suggests its newer products and services will catalyze better top-line performance, it is still below the sector average.
Today’s young investors won’t have read the timeless lessons in Gorilla Game: Picking Winners In High Technology because it was written more than 20 years ago when Microsoft and Apple were first establishing their supremacy. But if we apply the same principles, then enterprise software stocks leveraging their own generative AI capabilities may well be the Gorillas of the future. So, in that spirit, we are excited to present our Special Free Report on a profitable, fast-growing enterprise software stock that is already riding the automation wave and looking to catch the generative AI next.
Operating Margin
Operating margin is an important measure of profitability as it shows the portion of revenue left after accounting for all core expenses – everything from the cost of goods sold to advertising and wages. It’s also useful for comparing profitability across companies with different levels of debt and tax rates because it excludes interest and taxes.
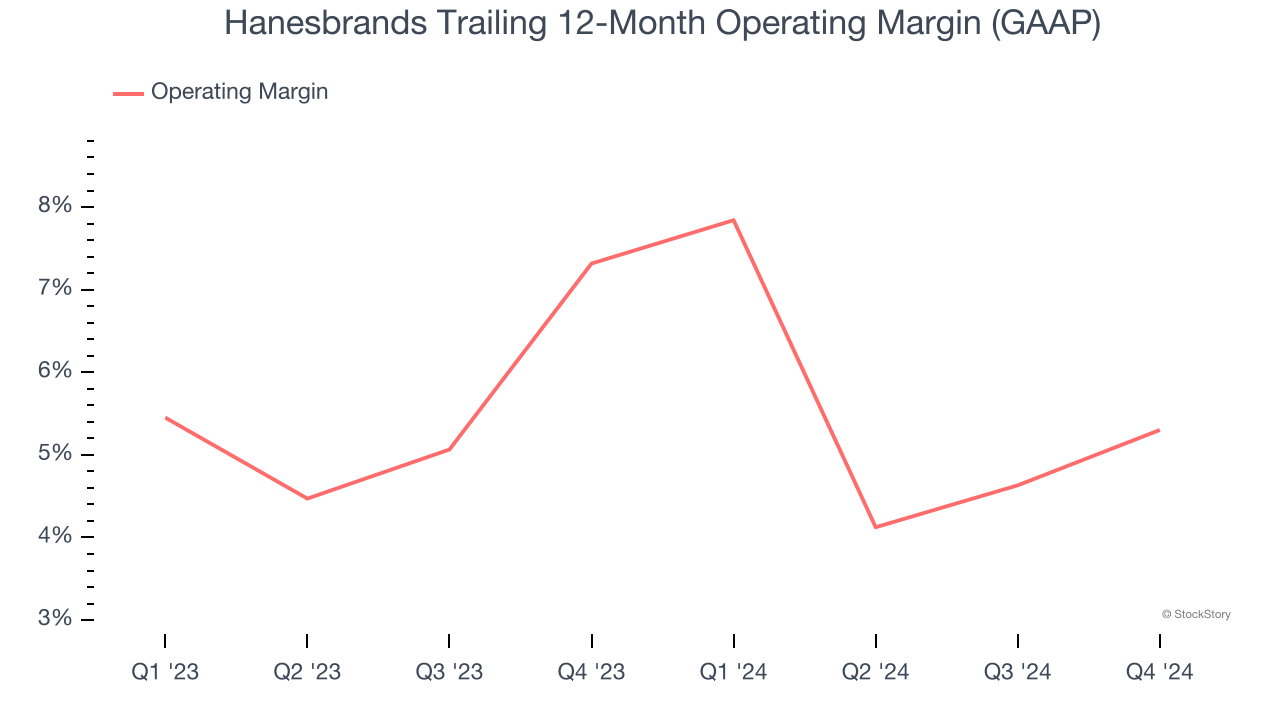
in line with the same quarter last year. This indicates the company’s overall cost structure has been relatively stable.
Earnings Per Share
We track the long-term change in earnings per share (EPS) for the same reason as long-term revenue growth. Compared to revenue, however, EPS highlights whether a company’s growth is profitable.
Sadly for Hanesbrands, its EPS declined by 14.6% annually over the last five years, more than its revenue. This tells us the company struggled because its fixed cost base made it difficult to adjust to shrinking demand.
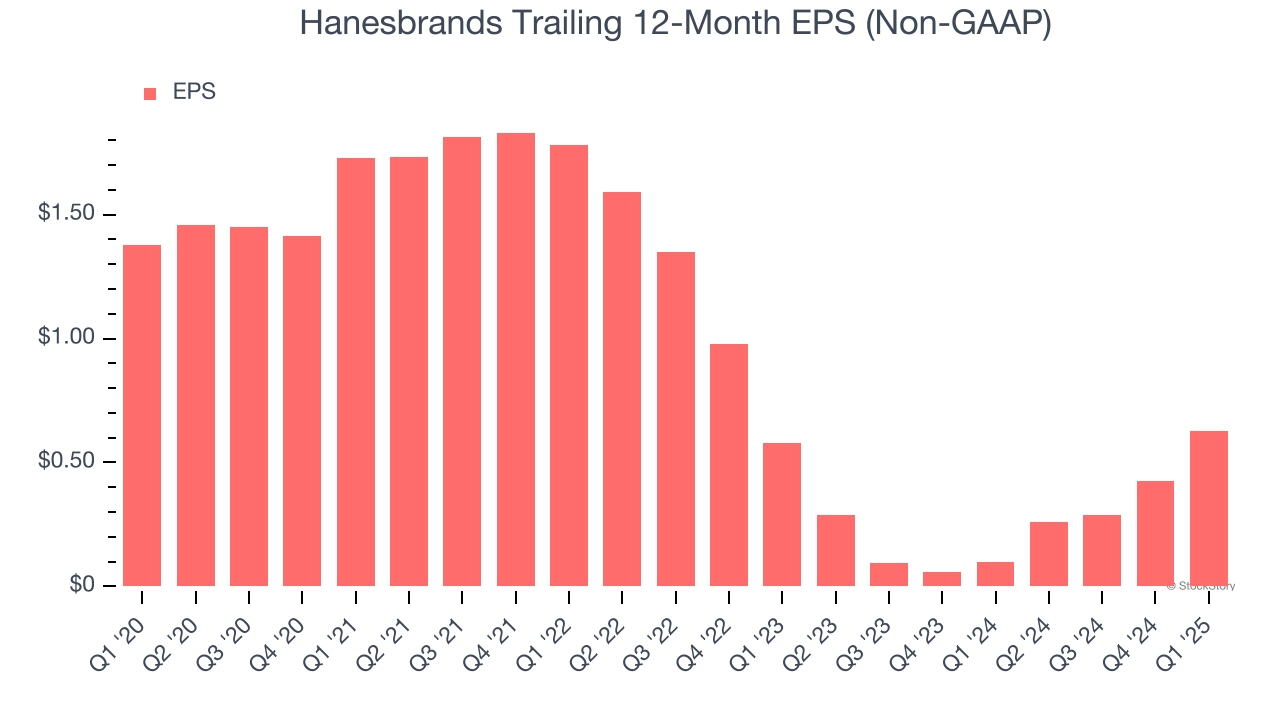
In Q1, Hanesbrands reported EPS at $0.18, up from negative $0.02 in the same quarter last year. This print easily cleared analysts’ estimates, and shareholders should be content with the results. Over the next 12 months, Wall Street expects Hanesbrands’s full-year EPS of $0.63 to shrink by 17.1%.
Key Takeaways from Hanesbrands’s Q1 Results
We were impressed by how significantly Hanesbrands blew past analysts’ constant currency revenue expectations this quarter. We were also excited its EPS outperformed Wall Street’s estimates. Overall, this print had some key positives. The stock traded up 8.4% to $5.29 immediately following the results.
Hanesbrands may have had a good quarter, but does that mean you should invest right now? We think that the latest quarter is only one piece of the longer-term business quality puzzle. Quality, when combined with valuation, can help determine if the stock is a buy. We cover that in our actionable full research report which you can read here, it’s free.


