Biotech company Biogen (NASDAQ: BIIB) announced better-than-expected revenue in Q3 2026, with revenue up 10.6% year on year to $2.80 billion. Its non-GAAP profit of $2.62 per share was 32.5% above analysts’ consensus estimates.
For more on Biogen, read the full research report, available free.
Biogen (BIIB) Q3 2026 highlights:
- Revenue $2.80 billion vs S&P analysts’ consensus estimates of $2.64 billion (10.6% year-on-year growth, 6.4% beat)
- Adjusted EPS $2.62 vs S&P analysts’ consensus estimates of $1.98 (32.5% beat)
- Adjusted EPS guidance Management raised its full-year adjusted EPS guidance to $12.60 at the midpoint, a 0.8% increase
- Free cash flow margin 24.3%, down from 48.4% in the same quarter last year
- Market capitalization $37.34 billion
Revenue growth
Examining a company’s long-term performance can provide clues about its quality. Any business can experience short-term success, but top-performing ones sustain growth for years. Biogen’s demand was weak over the last five years as its revenue fell at a 1.5% annual rate. That underwhelming result suggests poor business quality.
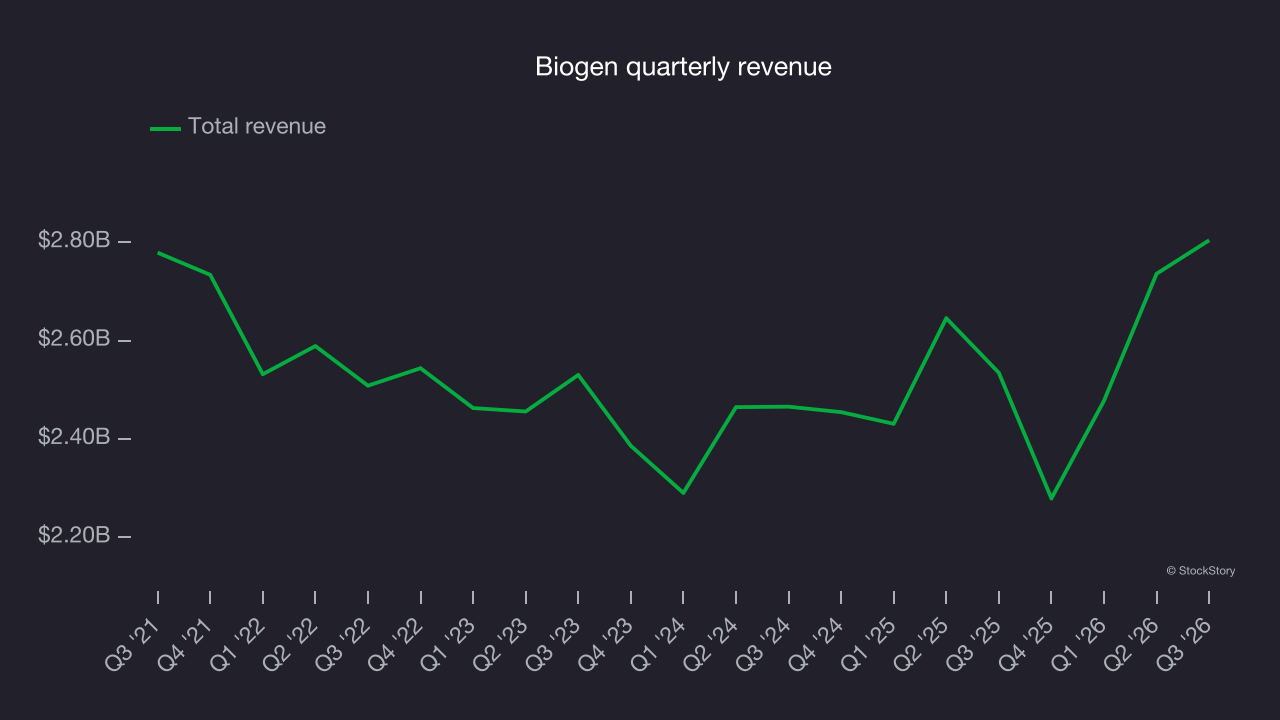
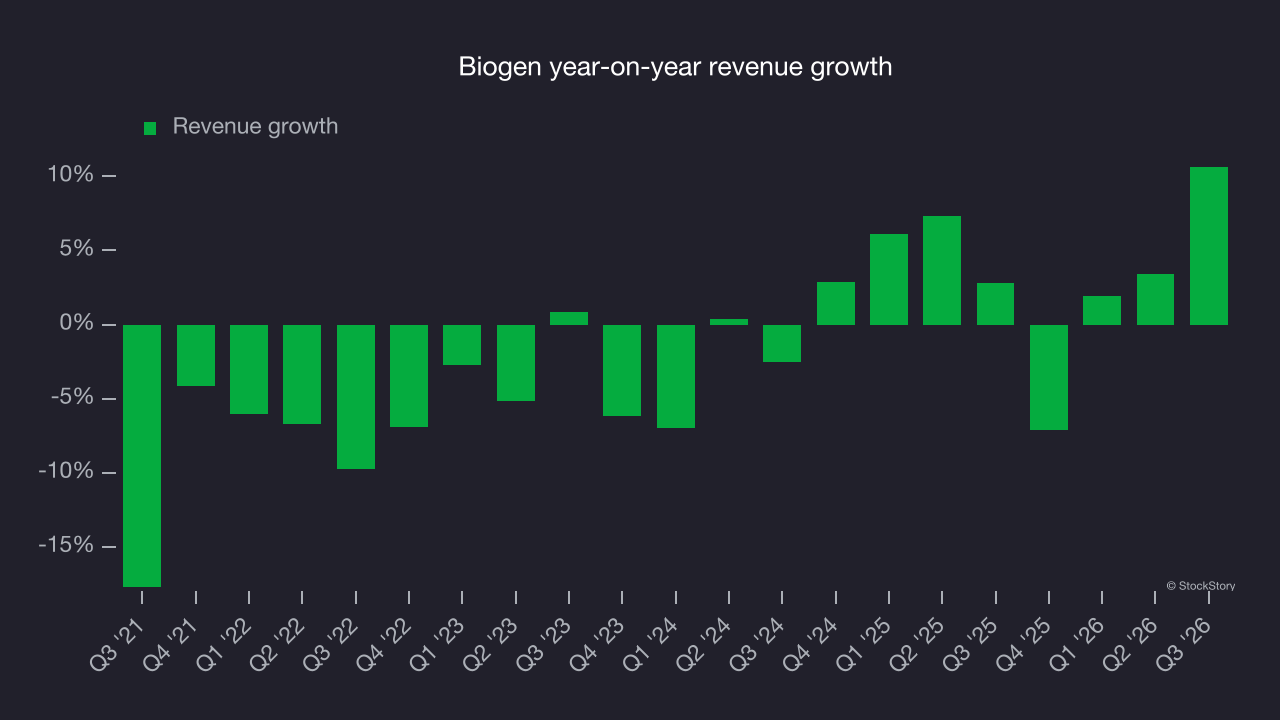
This quarter, Biogen reported year-on-year revenue growth of 10.6%, and its $2.80 billion of revenue exceeded Wall Street’s consensus estimates by 6.4%.
Looking ahead, sell-side analysts expect revenue to grow 3% over the next 12 months, according to S&P, similar to its two-year rate. This projection is underwhelming and implies its newer products and services will not accelerate its top-line performance yet.
Operating margin
Operating margin is a key measure of profitability. Think of it as net income, or the bottom line, excluding the impact of taxes and interest on debt, which are less connected to business fundamentals.
Biogen has been an efficient company over the last five years. It was one of the more profitable businesses in the healthcare sector, with an average operating margin of 21.8%.
Biogen’s operating margin decreased by 17.3 percentage points over the last five years. The company’s two-year trajectory also shows it failed to restore profitability to its peak as its margin fell by 15.2 percentage points. This poor performance shows its expenses were rising and it couldn’t pass those costs on to its customers.
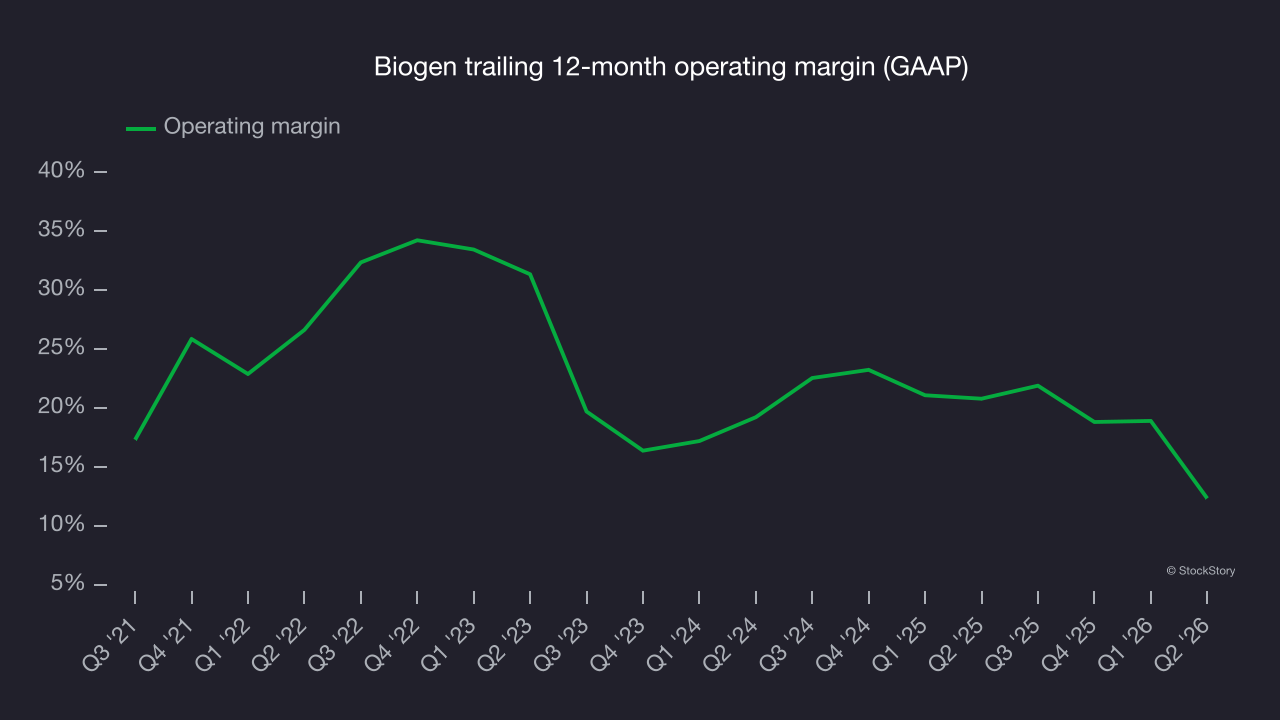
in line with the same quarter last year. This indicates the company’s overall cost structure has been relatively stable.
Earnings per share
Revenue trends explain a company’s historical growth, but the long-term change in earnings per share (EPS) points to the profitability of that growth – for example, a company could inflate its revenue through excessive spending on advertising and promotions.
Biogen’s EPS declined by 10.4% annually over the last five years, more than its revenue. The company struggled because its fixed cost base made it difficult to adjust to shrinking demand.
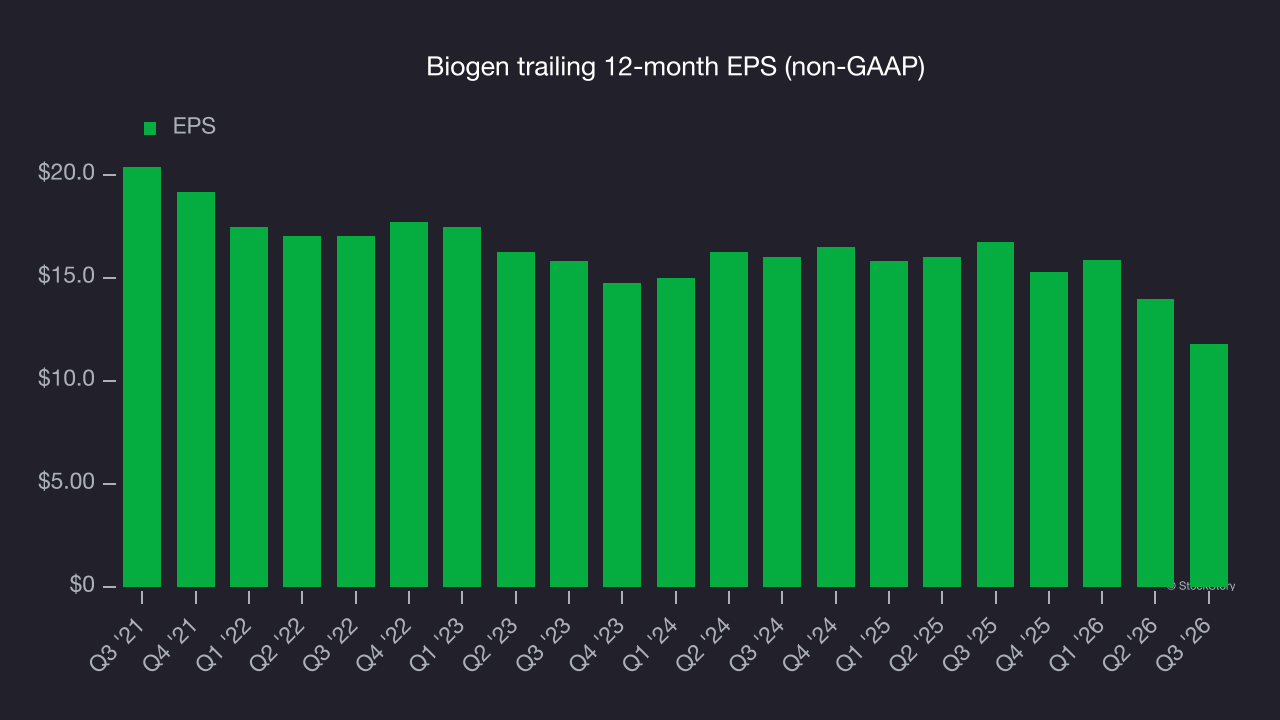
A closer look at Biogen’s earnings helps explain the drivers of its performance. As noted earlier, Biogen’s operating margin declined by 17.3 percentage points over the last five years. This was the most relevant factor (aside from the revenue impact) behind its lower earnings; interest expenses and taxes can also affect EPS but don’t tell us as much about a company’s fundamentals.
In Q3, Biogen reported adjusted EPS of $2.62, down from $4.81 in the same quarter last year. Despite falling year on year, adjusted EPS came in well above analysts’ consensus estimates. Over the next 12 months, Wall Street expects Biogen’s full-year EPS to grow 28.8% from $11.78 to $15.17, according to S&P.
Key takeaways from Biogen’s Q3 results
Biogen delivered a solid quarter, with revenue beating Wall Street’s consensus estimates by a wide margin and EPS also topping analysts’ consensus expectations. Shares remained flat at $252.50 immediately after the results.
Biogen’s latest quarter is only one piece of its longer-term business quality picture. Quality, combined with valuation, can help determine whether the stock is a buy. For more on Biogen, read the full research report here (it’s free).