Geospatial technology provider Trimble (NASDAQ: TRMB) met Wall Street’s revenue expectations in Q3 2026, with revenue up 7.3% year on year to $966.8 million. On the other hand, next quarter’s revenue guidance of $1.05 billion was less impressive, coming in 0.6% below analysts’ consensus estimates. Its non-GAAP profit of $0.86 per share was in line with analysts’ consensus estimates.
For more on Trimble, read our free full research report.
Trimble (TRMB) Q3 2026 highlights:
- Revenue $966.8 million vs S&P analysts’ consensus estimates of $966.5 million (7.3% year-on-year growth, in line)
- Adjusted EPS $0.86 vs S&P analysts’ consensus estimates of $0.86 (in line)
- Revenue guidance $1.05 billion at the midpoint for Q4 2026, below analysts’ consensus estimates of $1.05 billion
- Adjusted EPS guidance Management slightly raised its full-year adjusted EPS guidance to $3.66 at the midpoint
- Operating margin 14.7%, down from 16.7% in the same quarter last year
- Free cash flow margin 14.7%, up from 12.9% in the same quarter last year
- Organic revenue rose 7% year on year (beat)
- Market capitalization $15.3 billion
"Our third quarter results surpassed expectations on both revenue and earnings per share, while delivering record annualized recurring revenue of $2.56 billion," said Rob Painter, President and CEO of Trimble. "Our full year 2026 guidance reflects solid execution against our Connect & Scale strategy, which continues to leverage our unique presence across the physical and digital worlds with our unmatched breadth and depth of connected industry data."
Revenue growth
A company’s long-term performance is an indicator of its overall quality. Any business can experience short-term success, but top-performing ones sustain growth for years. Over the last five years, Trimble grew its revenue at a sluggish 1.6% compounded annual growth rate, falling short of our standards.
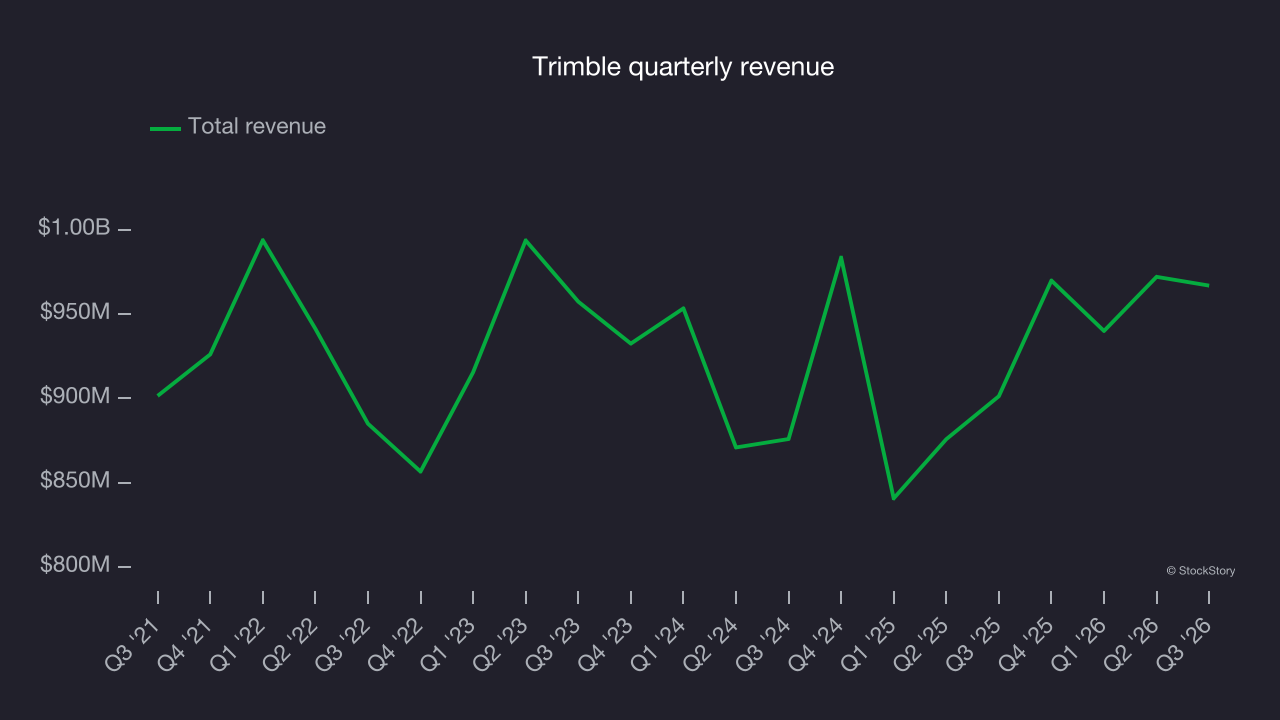
Long-term growth matters most, but within industrials, a half-decade historical view may miss cycles, industry trends or a company capitalizing on catalysts such as a new contract win or a successful product line. Trimble’s annualized revenue growth of 2.9% over the last two years is above its five-year trend, a positive sign. 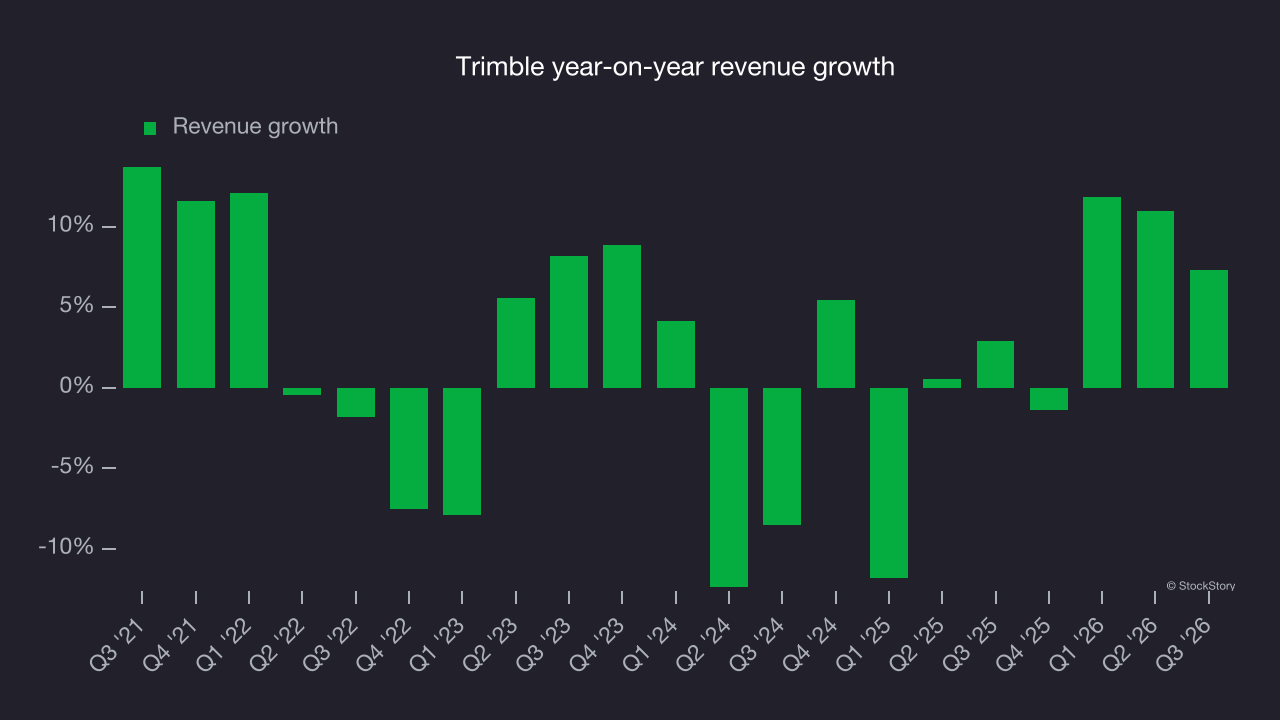
Organic revenue offers a closer look at the company’s revenue dynamics by stripping out one-time events like acquisitions and currency fluctuations that don’t accurately reflect its fundamentals. Over the last two years, Trimble’s organic revenue averaged 9% year-on-year growth. This outpaced its two-year revenue growth, indicating that some combination of divestitures and foreign exchange rates dampened its headline results. 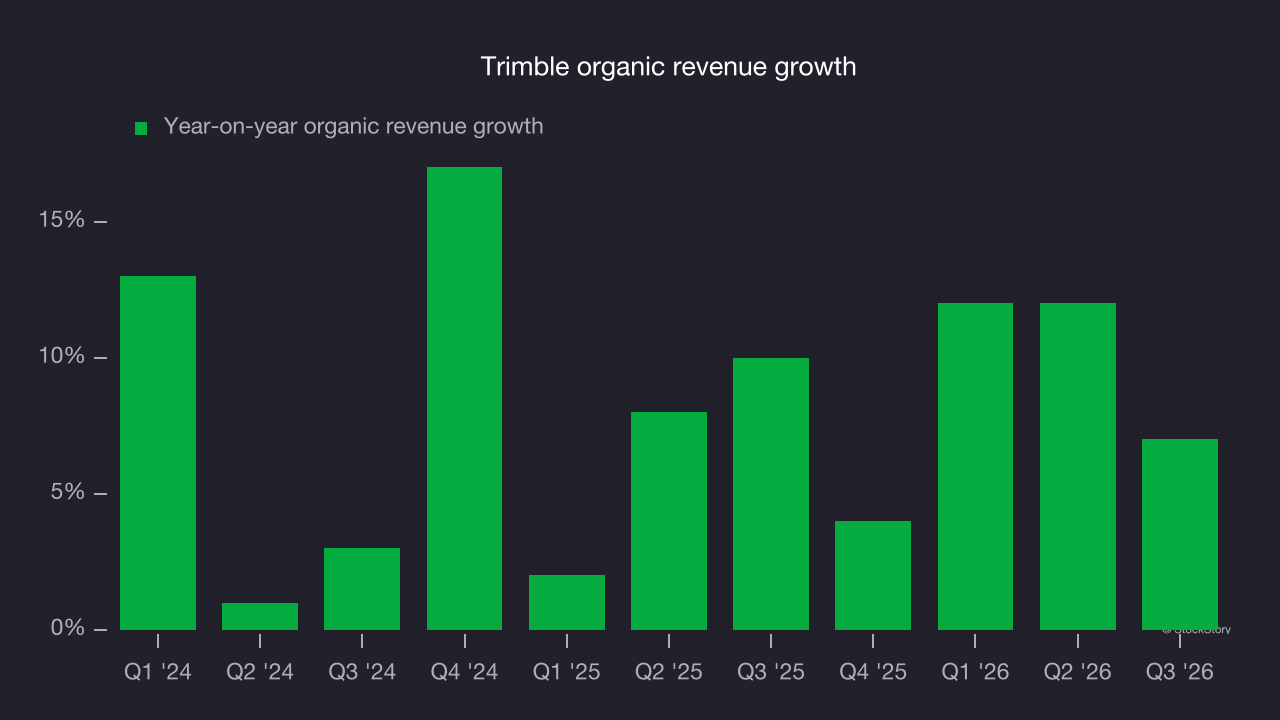
This quarter, Trimble grew its revenue by 7.3% year on year, and its $966.8 million of revenue was in line with Wall Street’s consensus estimates. Management is guiding for a 7.9% year-on-year increase in revenue next quarter.
Looking further ahead, sell-side analysts expect revenue to grow 7% over the next 12 months, according to S&P. Although this projection implies its newer products and services will spur better top-line performance, it is still below average for the sector.
Operating margin
Operating margin is a key measure of profitability. Think of it as net income, the bottom line, excluding the impact of taxes and interest on debt, which are less connected to business fundamentals.
Trimble has been an efficient company over the last five years. It was one of the more profitable businesses in the industrials sector, with an average operating margin of 13.8%. That result is unsurprising given its favorable gross margin baseline.
Looking at the trend in its profitability, Trimble’s operating margin rose by 2 percentage points over the last five years, as its revenue growth gave it operating leverage.
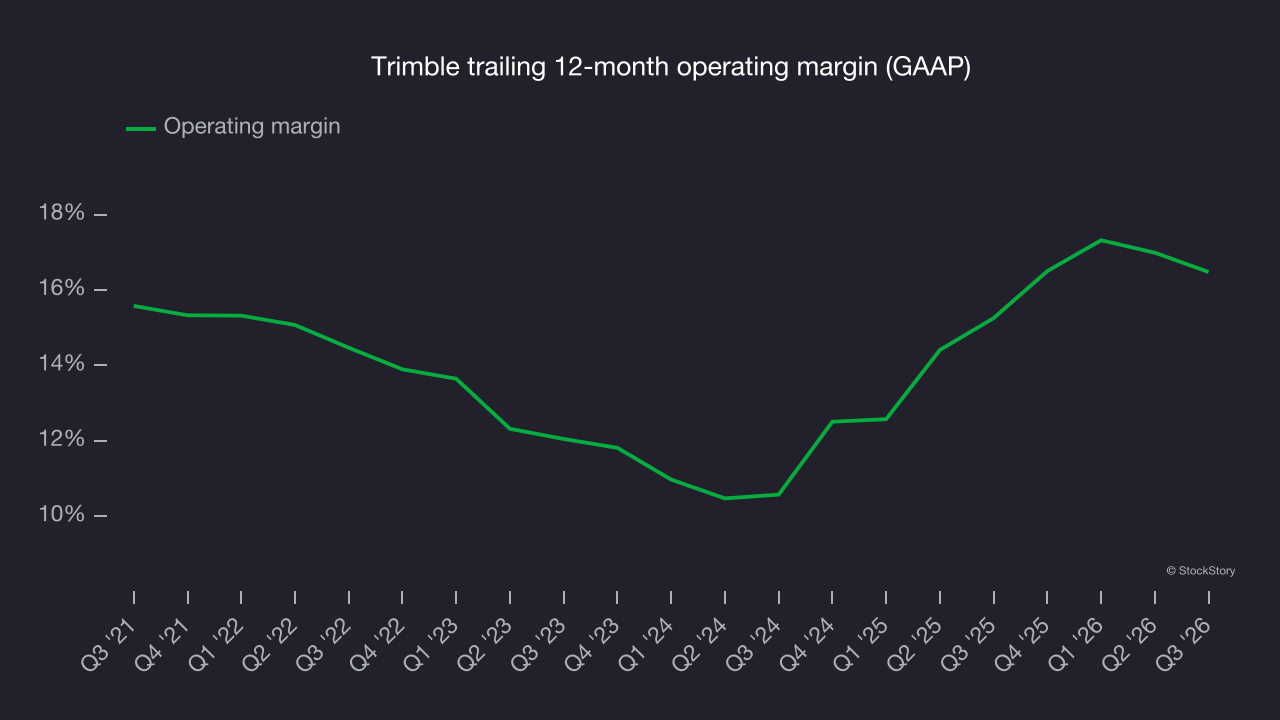
This quarter, Trimble generated an operating margin of 14.7%, down 2 percentage points year on year. The larger decline in its gross margin suggests its recent inefficiencies were driven more by weaker leverage on its cost of sales than by increases in research and development expenses and marketing and administrative overhead.
Earnings per share
We track the long-term change in earnings per share, or EPS, for the same reason as long-term revenue growth. Compared to revenue, however, EPS highlights whether a company’s growth is profitable.
Trimble’s EPS grew at a 5.8% compounded annual growth rate over the last five years. On the positive side, this performance was better than its 1.6% annualized revenue growth, indicating the company became more profitable on a per-share basis as it expanded.
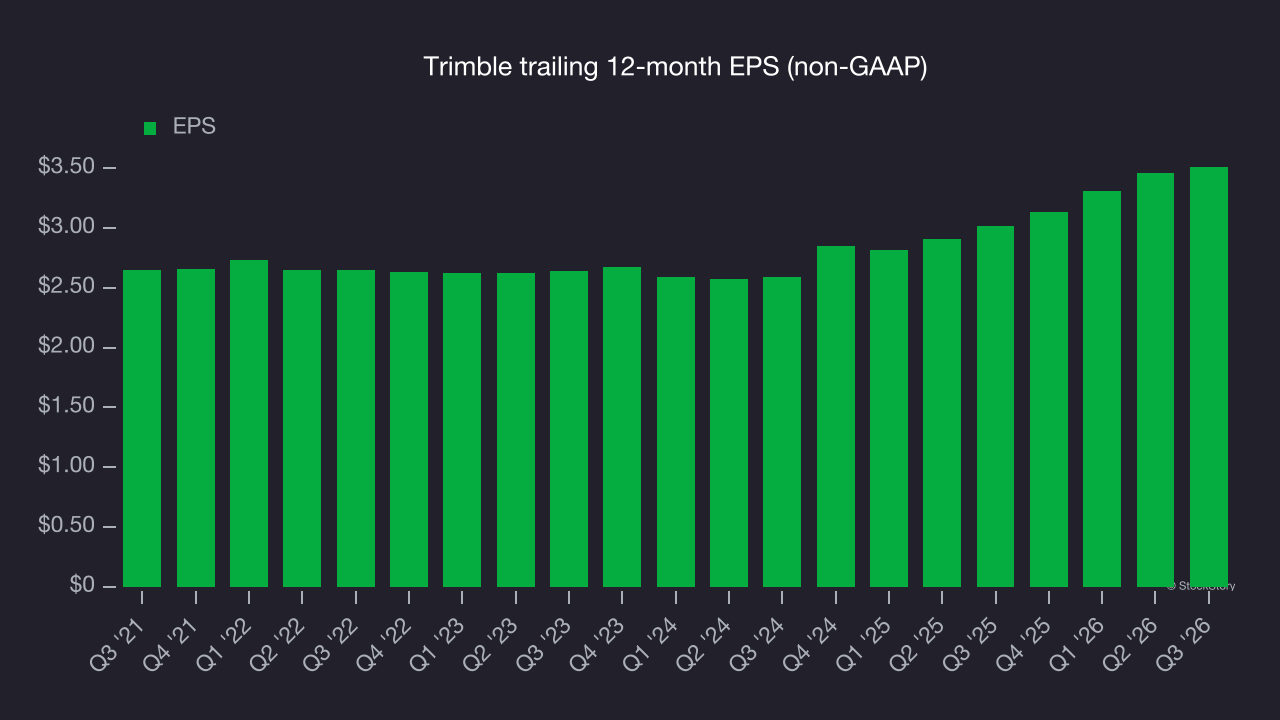
A closer look at Trimble’s earnings helps explain its performance. As noted earlier, Trimble’s operating margin declined this quarter but expanded by 2 percentage points over the last five years. Its share count also shrank by 8.4%, and these factors together are positive signs for shareholders because improving profitability and share buybacks boost EPS growth relative to revenue growth. 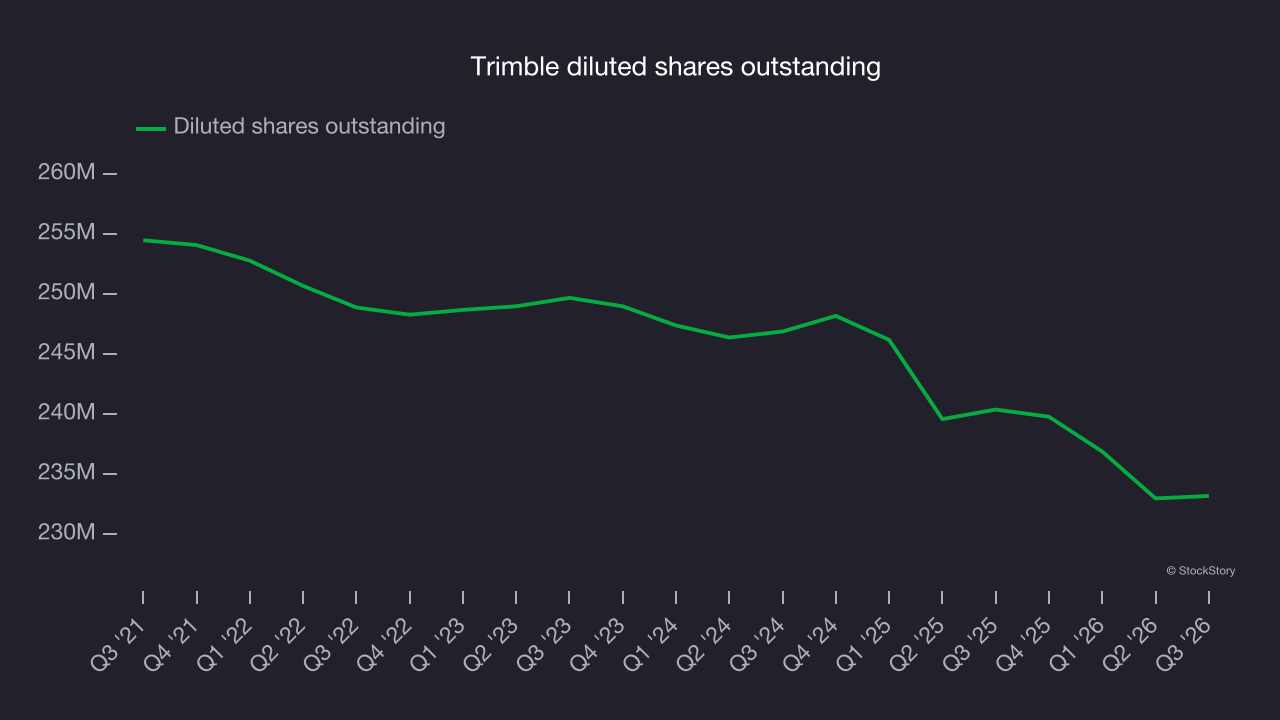
Like with revenue, we analyze EPS over a more recent period because it can provide insight into an emerging theme or development for the business.
For Trimble, its two-year annual EPS growth of 16.4% was higher than its five-year trend. This acceleration made it one of the faster-growing industrials companies in recent history.
In Q3, Trimble reported adjusted EPS of $0.86, up from $0.81 in the same quarter last year. This result was close to analysts’ consensus estimates. Over the next 12 months, Wall Street expects Trimble’s full-year EPS to grow 14% from $3.51 to $4.00, according to S&P.
Key takeaways from Trimble’s Q3 results
Trimble’s Q3 results offered few positives, making this a disappointing quarter. Shares tumbled 7.3% to $60.84 immediately after the report.
Evaluating Trimble as an investment at its current price means considering its valuation, business quality and latest quarterly results. Read the full research report here (it’s free).