Energy and industrial distributor DNOW (NYSE: DNOW) fell short of the market’s revenue expectations in Q3 2026, but revenue rose 111% year on year to $1.34 billion. Its non-GAAP profit of $0.18 per share was 21.6% above analysts’ consensus estimates.
For more on DNOW, read the full research report for free.
DNOW (DNOW) Q3 2026 highlights:
- Revenue $1.34 billion vs S&P analysts’ consensus estimates of $1.35 billion (111% year-on-year growth, 0.9% miss)
- Adjusted EPS $0.18 vs S&P analysts’ consensus estimates of $0.15 (21.6% beat)
- Adjusted EBITDA $76 million vs analysts’ consensus estimates of $72.52 million (5.7% margin, 4.8% beat)
- Operating margin 2.5%, down from 4.9% in the same quarter last year
- Free cash flow margin 7.9%, up from 6.2% in the same quarter last year
- Market capitalization $2.78 billion
Prior to the earnings conference call, a presentation titled “DNOW Third Quarter 2026 Earnings Presentation” will be available on the company’s investor relations website.
Revenue growth
A company’s long-term revenue performance is one signal of its overall quality. Even a bad business can perform well for one or two quarters, but a top-tier one grows for years. Over the last five years, DNOW grew its revenue at a strong 25.8% compounded annual growth rate. Its growth beat the average industrials company and shows its offerings resonate with customers.
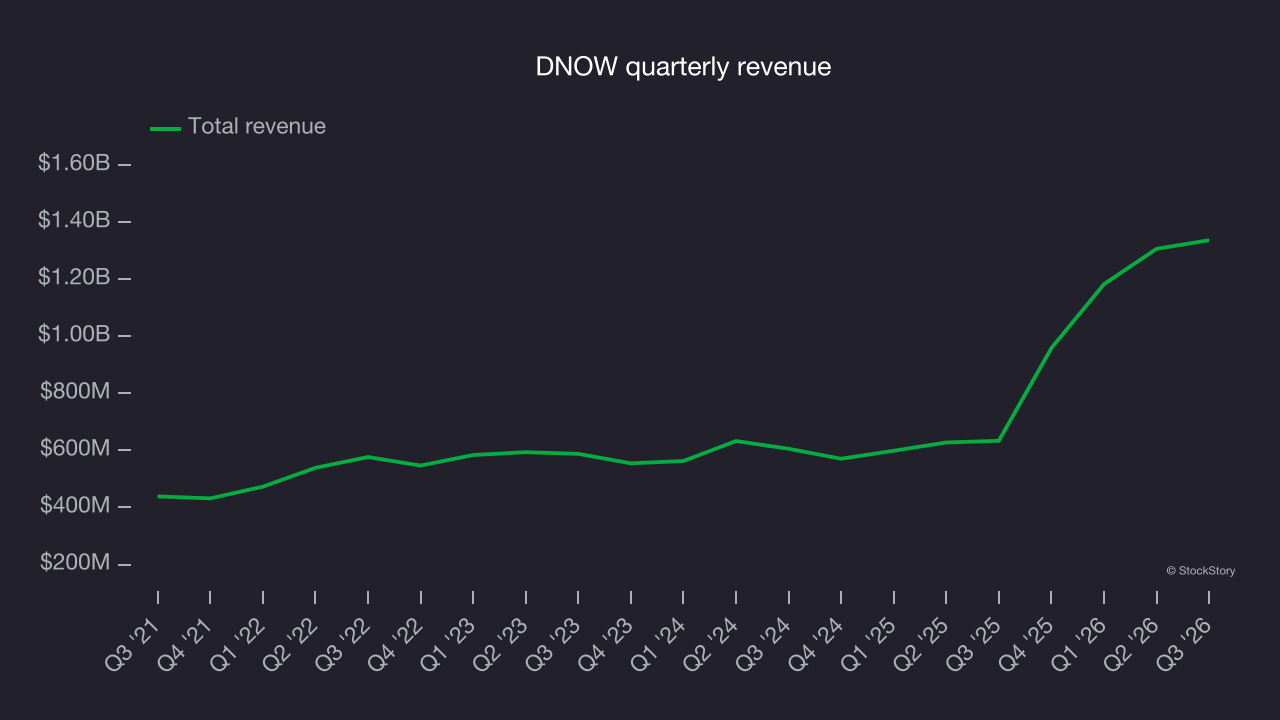
Long-term growth is the most important, but within industrials, a half-decade historical view may miss new industry trends or demand cycles. DNOW’s annualized revenue growth of 42.5% over the last two years is above its five-year trend, suggesting its demand was strong and recently accelerated. 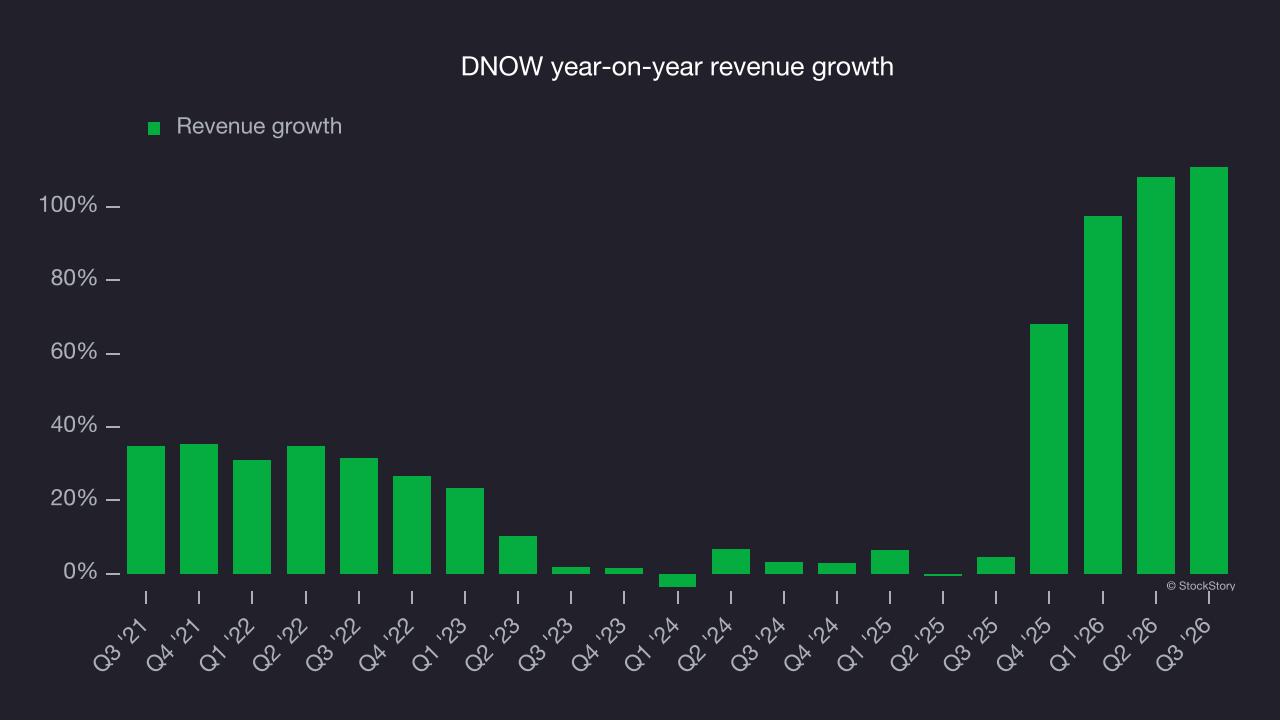
This quarter, DNOW reported strong year-on-year revenue growth of 111%, but its $1.34 billion in revenue fell short of Wall Street’s consensus estimates.
Looking ahead, sell-side analysts expect revenue to grow 11.2% over the next 12 months, according to S&P, a deceleration versus the last two years. Despite the slowdown, this projection is noteworthy and implies the market expects its products and services to succeed.
Operating margin
DNOW was profitable over the last five years but held back by its large cost base. Its average operating margin of 2% was weak for an industrials business. That outcome is unsurprising given its low gross margin baseline.
DNOW’s operating margin decreased by 9 percentage points over the last five years. This raises questions about the company’s expense base because its revenue growth should have given it leverage on its fixed costs, resulting in better economies of scale and profitability. DNOW’s poor performance indicates that costs were rising and it couldn’t pass them on to its customers.
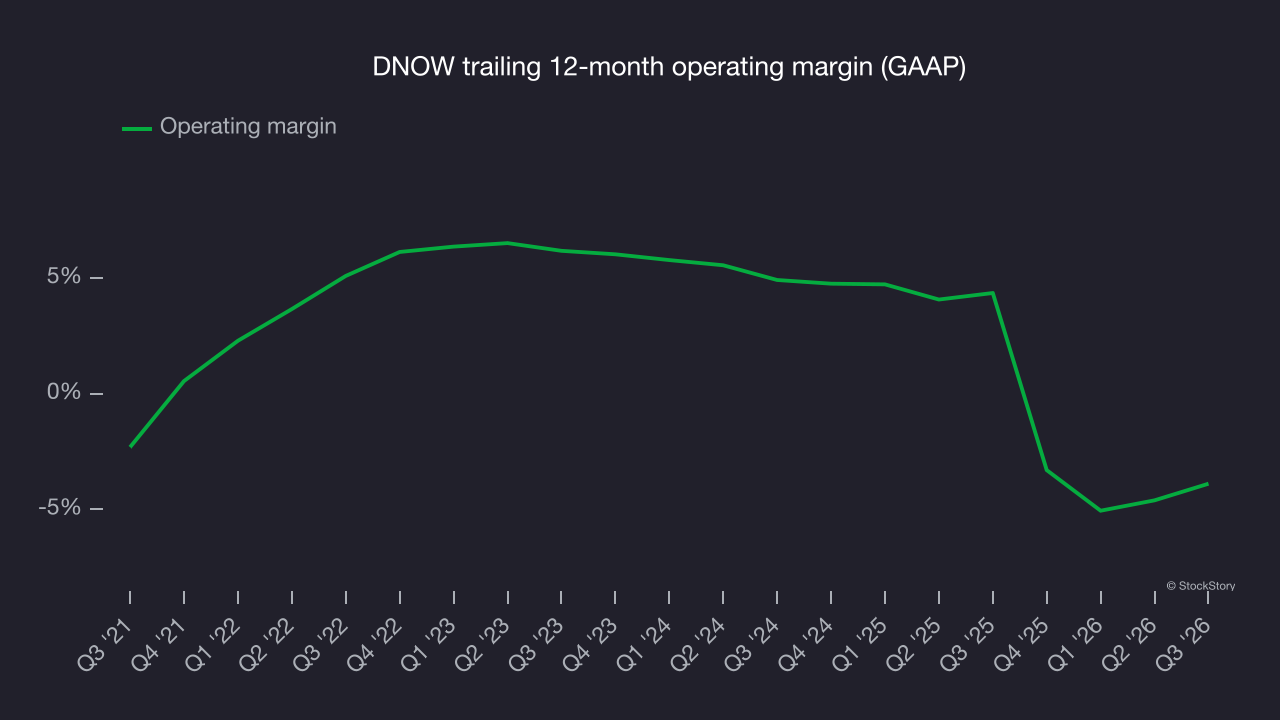
This quarter, DNOW generated an operating margin of 2.5%, down 2.4 percentage points year on year. Since DNOW’s gross margin decreased more than its operating margin, its recent inefficiencies appear to have been driven more by weaker leverage on its cost of sales than by increased marketing, research and development and administrative overhead expenses.
Earnings per share
Revenue trends explain a company’s historical growth, but the long-term change in earnings per share (EPS) points to the profitability of that growth. For example, a company could inflate its revenue through excessive spending on advertising and promotions.
DNOW’s full-year EPS turned positive over the last five years. This is a positive sign and marks a critical stage in the company’s development.
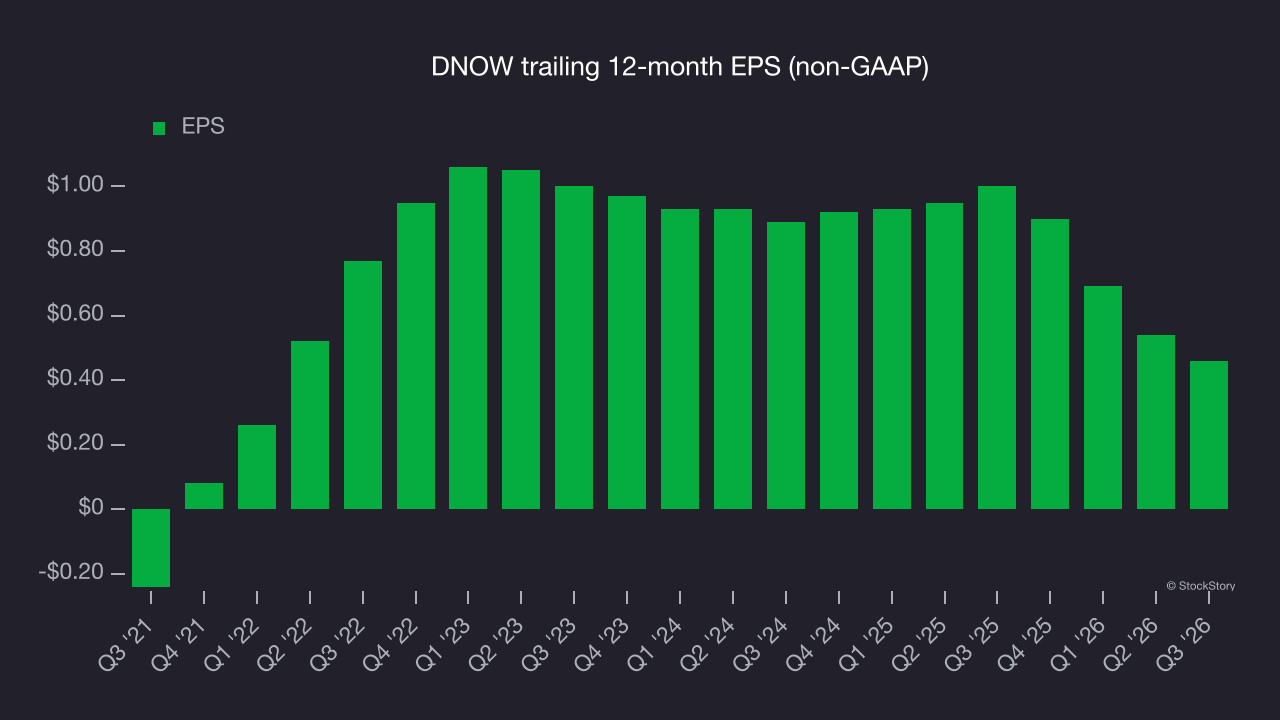
As with revenue, we analyze EPS over a more recent period because it can provide insight into an emerging theme or development for the business.
DNOW’s EPS declined by 28.1% annually over the last two years while its revenue grew by 42.5%. This tells us the company became less profitable on a per-share basis as it expanded.
We can take a deeper look into DNOW’s earnings to better understand the drivers of its performance. DNOW’s operating margin has declined over the last two years while its share count has grown 70.1%. This means the company not only became less efficient with its operating expenses but also diluted its shareholders. 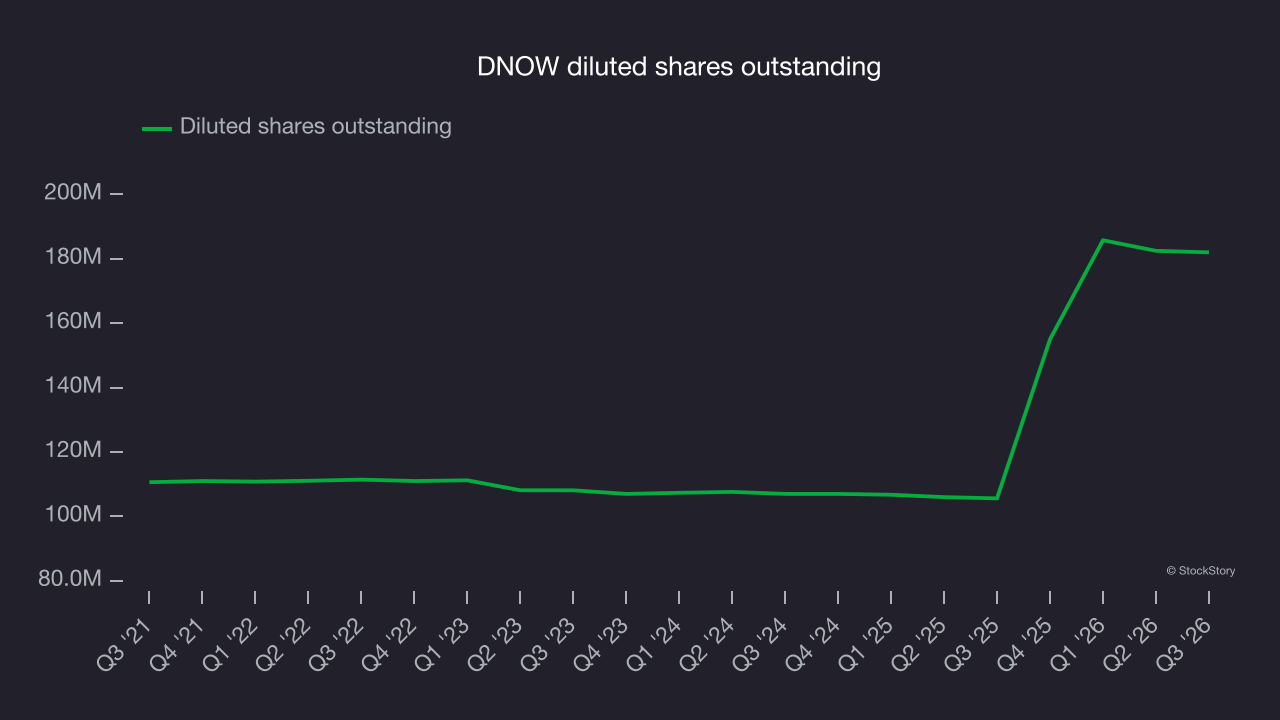
In Q3, DNOW reported adjusted EPS of $0.18, down from $0.26 in the same quarter last year. Despite falling year on year, the result came in well above analysts’ consensus estimates. There is insufficient data to assess expected EPS growth based on Wall Street analysts’ consensus projections.
Key takeaways from DNOW’s Q3 results
DNOW’s Q3 results were decent, with EPS and EBITDA both topping analysts’ consensus estimates but revenue falling slightly short. Those earnings beats were the quarter’s key positives. Shares remained flat at $15.37 immediately after the results.
When evaluating DNOW at its current price, longer-term business quality and valuation matter more than the latest quarterly results. Read the full research report here (it’s free).