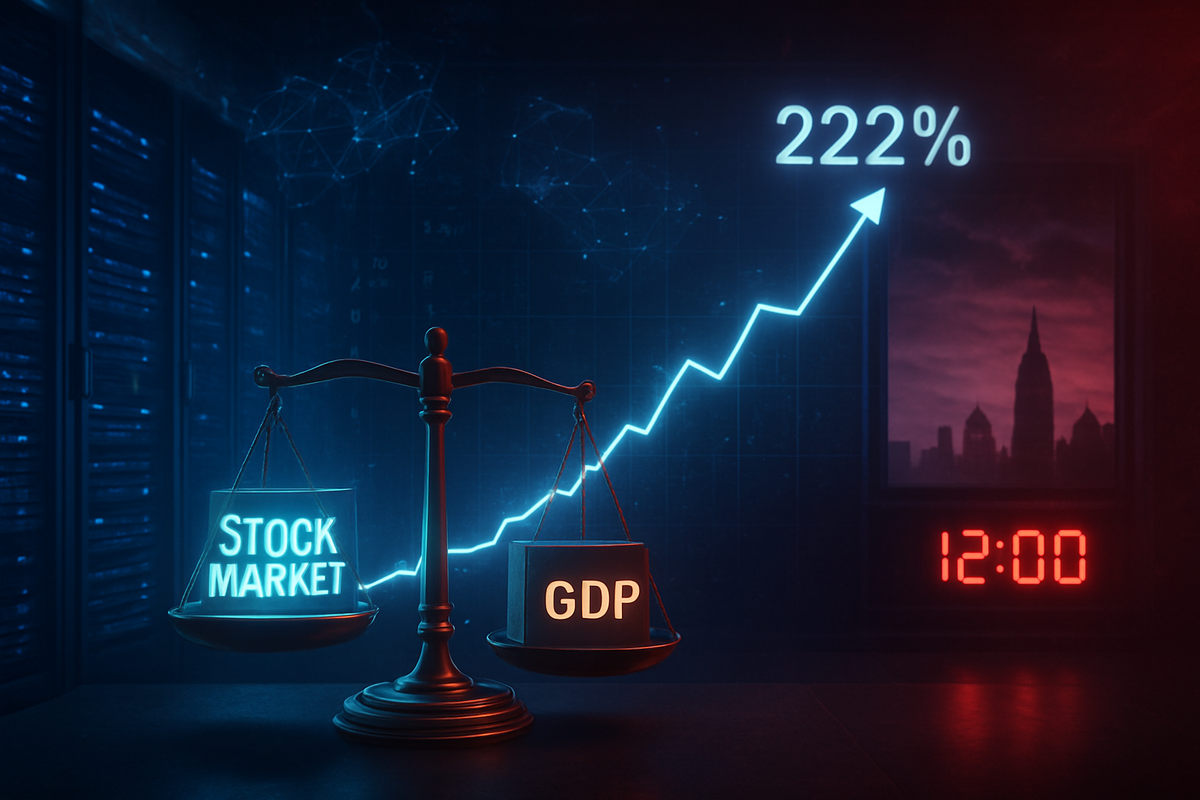
As the final trading days of 2025 draw to a close, the U.S. stock market finds itself at a historic and potentially perilous crossroads. The "Buffett Indicator"—a long-revered metric that compares the total market capitalization of all publicly traded U.S. stocks to the nation’s Gross Domestic Product (GDP)—has surged to a staggering 222%. This level is not just a new record; it is a siren song of overvaluation that has historically preceded significant market corrections. With the S&P 500 hovering near the 6,300 mark, the gap between financial valuations and the underlying economic reality has never been wider.
The immediate implications are sobering for an investment landscape dominated by artificial intelligence. While the "AI trade" has propelled the market to these heights, the indicator’s current reading suggests that investors are paying a massive premium for future growth that may not yet be supported by actual productivity gains. As Warren Buffett prepares to step down from his role at Berkshire Hathaway (NYSE: BRK.B) tomorrow, December 31, 2025, his decision to sit on a record-breaking $381.7 billion in cash serves as a silent but powerful warning to those still chasing the AI-driven rally.
A Historic Peak: The Path to 222%
The ascent of the Buffett Indicator to its current 222% level has been a two-year journey of relentless expansion. Throughout late 2024 and 2025, the U.S. economy maintained a steady but modest growth rate, while the stock market, fueled by the promise of generative AI, detached from traditional valuation anchors. In July 2025, when the S&P 500 first crossed the 6,000 threshold, the indicator surpassed the 210% mark, already eclipsing the peak of the 2000 Dot-com bubble and the 2021 post-pandemic surge. By September 2025, some variations of the metric using the Wilshire 5000 index reached as high as 230%.
This timeline of exuberance has been met with a calculated retreat by the man the indicator is named after. Warren Buffett has been a net seller of stocks for 12 consecutive quarters as of the end of 2025. The "Oracle of Omaha" has spent much of the past year liquidating massive portions of his most prized holdings, including a 70% reduction in his stake in Apple (NASDAQ: AAPL) and a significant exit from financial staples like Bank of America (NYSE: BAC) and Citigroup (NYSE: C). During his final annual meeting in May 2025, Buffett remarked that he found virtually no "attractively priced investments," characterizing the current market as the most expensive he has seen in his 95 years.
The reaction from the broader market has been a mix of defiance and growing anxiety. While retail investors and momentum-driven funds have continued to pour capital into the "Magnificent Seven," institutional players have begun to voice concerns. The Bank of America October 2025 Global Fund Manager Survey listed an "AI Equity Bubble" as the top global tail risk for the first time in history. Despite these warnings, the sheer momentum of AI infrastructure spending—which topped $400 billion in 2025—has kept the indicator pinned at these extreme levels.
Winners, Losers, and the Concentration of Risk
The primary drivers of this valuation spike are a handful of tech titans that now represent over 30% of the S&P 500's total value. NVIDIA (NASDAQ: NVDA) stands at the center of this storm, having become the first company to hit a $5 trillion market capitalization in late 2025. While NVIDIA's revenue growth has been phenomenal, its trailing price-to-earnings (P/E) ratio has stretched to nearly 53x, far above its 10-year median. The company remains the clear winner of the infrastructure phase, but its valuation now assumes a level of perpetual dominance that leaves little room for error.
On the other side of the ledger, long-term value investors and defensive sectors have struggled to keep pace. Companies like Microsoft (NASDAQ: MSFT) and Alphabet (NASDAQ: GOOGL) have seen their market caps balloon to $4.3 trillion and $3.8 trillion respectively, but they face a growing "revenue sustainability gap." An influential MIT report released in August 2025 highlighted that while enterprises have invested tens of billions into generative AI, nearly 95% of organizations are still struggling to see a tangible return on that investment. This creates a precarious situation for the "hyperscalers" who are both the biggest buyers of AI chips and the biggest sellers of AI services.
Potential losers in this environment include traditional financial institutions and consumer staples that lack an "AI narrative." As capital is sucked into the tech vortex, these sectors have seen their relative valuations wither. Furthermore, if the Buffett Indicator's warning proves true and a correction ensues, the high-flying tech stocks with the most "froth" will have the furthest to fall. Apple (NASDAQ: AAPL), despite joining the $4 trillion club in October 2025, faces particular scrutiny as its "Apple Intelligence Pro" subscription model undergoes its first real test of consumer demand in a tightening economy.
The AI Bubble vs. The Dot-Com Precedent
The current situation bears a striking, if imperfect, resemblance to the late 1990s. The Buffett Indicator peaked at roughly 159% during the Dot-com bubble; the fact that it now sits at 222% suggests a level of speculation that is numerically superior to the year 2000. However, analysts point out that today's tech leaders are far more profitable than the "pets.com" era startups. The S&P 500's average P/E ratio of 30x in late 2025 is high, but it is not the 100x+ multiples seen in 1999.
Yet, new risks have emerged that didn't exist 25 years ago. The "DeepSeek shock" of January 2025, where a Chinese AI model demonstrated high performance at a fraction of the cost of U.S. counterparts, sent ripples through the industry. It raised the specter of "AI commoditization," where the massive capital expenditures of U.S. firms might be undercut by more efficient, lower-cost models. This has led to fears of "circular financing," a scenario where tech giants invest in AI startups that then use that money to buy services from the same tech giants, artificially inflating revenue and market caps.
Broader industry trends also suggest a shift in the regulatory climate. As AI's influence on the economy grows, so does the scrutiny from policymakers regarding data privacy, energy consumption, and labor displacement. The historical precedent for a Buffett Indicator reading this high is almost always a period of "lost decade" returns. With the Case-Shiller P/E (CAPE) ratio exceeding 40 for the first time since the 2000 crash, the wider significance is clear: the market has priced in a "Goldilocks" scenario for AI that ignores the historical reality of technological adoption curves and economic cycles.
What Comes Next: The 2026 Outlook
As we look toward 2026, the market faces several potential "pivots." The most immediate is the leadership change at Berkshire Hathaway. Greg Abel will take over as CEO on January 1, 2026, inheriting a "clean slate" and a massive cash hoard. This positioning suggests that the world's most successful value investor expects a significant "buying opportunity" to emerge in the near future—one that will only arrive if the current market levels undergo a substantial correction.
In the short term, the market may continue to defy gravity as long as AI earnings continue to beat expectations. However, the long-term outlook is increasingly challenged by the "fat pitch" philosophy. If the Buffett Indicator begins to revert to its historical mean of 122%, it would imply a massive contraction in market value. Strategic pivots will be required for investors who have become over-indexed on tech; a rotation into undervalued "old economy" stocks or high-quality bonds may become the dominant theme of 2026 as the AI trade matures.
Market opportunities may emerge in "AI efficiency" rather than "AI infrastructure." As the initial build-out phase concludes, the companies that can actually turn AI into bottom-line profits—rather than just top-line hype—will separate themselves from the pack. However, the overarching scenario remains one of caution. The "Buffett Indicator" has a track record of being early, but rarely wrong.
Summary and Investor Takeaways
The Buffett Indicator’s rise to 222% is a historic milestone that signals the U.S. stock market is significantly overvalued relative to the economy. With Warren Buffett exiting his post at Berkshire Hathaway (NYSE: BRK.A) while holding record cash levels, the message to investors is one of extreme defensiveness. The AI trade has provided the momentum for this surge, but the disconnect between $70 trillion in market cap and actual GDP growth suggests a correction may be on the horizon.
Moving forward, the market will likely be characterized by increased volatility as the "AI revenue gap" is tested. Investors should watch for signs of a "DeepSeek-style" disruption in AI pricing and keep a close eye on Berkshire Hathaway’s deployment of its cash pile under Greg Abel. The key takeaway is that while the technology of AI is transformative, the price being paid for it today is, by historical standards, unprecedented and potentially unsustainable.
In the coming months, the focus will shift from "how much can AI grow?" to "how much is that growth actually worth?" For those following the Buffett playbook, the current environment is not a time for FOMO (fear of missing out), but a time for discipline, capital preservation, and waiting for the "fat pitch" that high valuations currently deny.
This content is intended for informational purposes only and is not financial advice.