Outpatient physical therapy provider U.S. Physical Therapy (NYSE: USPH) reported Q1 CY2025 results topping the market’s revenue expectations, with sales up 18.1% year on year to $183.8 million. Its non-GAAP profit of $0.48 per share was 6.2% above analysts’ consensus estimates.
Is now the time to buy U.S. Physical Therapy? Find out by accessing our full research report, it’s free.
U.S. Physical Therapy (USPH) Q1 CY2025 Highlights:
- Revenue: $183.8 million vs analyst estimates of $176.1 million (18.1% year-on-year growth, 4.4% beat)
- Adjusted EPS: $0.48 vs analyst estimates of $0.45 (6.2% beat)
- Adjusted EBITDA: $19.54 million vs analyst estimates of $18.44 million (10.6% margin, 5.9% beat)
- Operating Margin: 10.7%, up from 9.2% in the same quarter last year
- Free Cash Flow was -$7.25 million, down from $2.58 million in the same quarter last year
- Sales Volumes rose 13.9% year on year (3.3% in the same quarter last year)
- Market Capitalization: $1.08 billion
Chris Reading, Chief Executive Officer, said, “Despite our weather-impacted start, we had strong referral and visit demand which accelerated nicely as the quarter progressed. Importantly, our insurance renegotiations and workers compensation efforts are giving us a lift as we enter one of the busiest seasonal periods of the year. While we have more work to do, we are encouraged by our start and committed to further progress.”
Company Overview
With a nationwide footprint spanning 671 clinics across 42 states, U.S. Physical Therapy (NYSE: USPH) operates a network of outpatient physical therapy clinics and provides industrial injury prevention services to employers across the United States.
Sales Growth
Reviewing a company’s long-term sales performance reveals insights into its quality. Any business can put up a good quarter or two, but many enduring ones grow for years. Thankfully, U.S. Physical Therapy’s 7.9% annualized revenue growth over the last five years was decent. Its growth was slightly above the average healthcare company and shows its offerings resonate with customers.
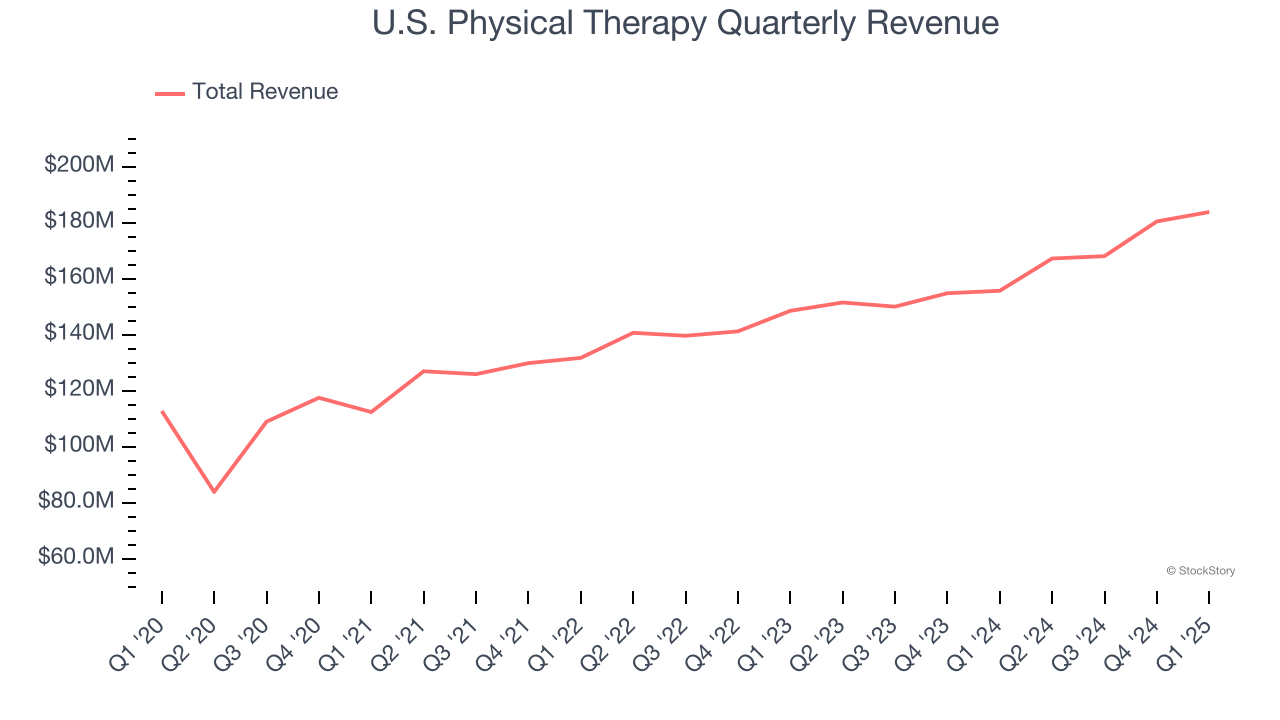
We at StockStory place the most emphasis on long-term growth, but within healthcare, a half-decade historical view may miss recent innovations or disruptive industry trends. U.S. Physical Therapy’s annualized revenue growth of 10.8% over the last two years is above its five-year trend, suggesting some bright spots. 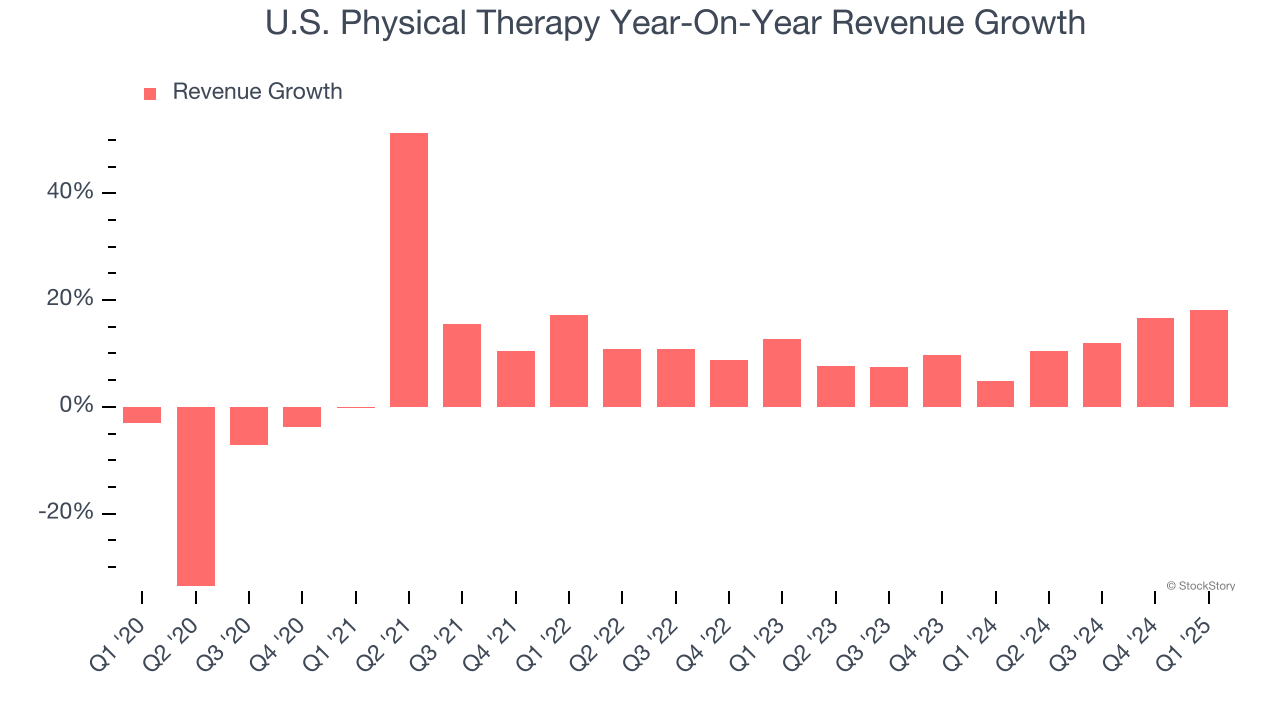
We can dig further into the company’s revenue dynamics by analyzing its number of patient visits, which reached 1.44 million in the latest quarter. Over the last two years, U.S. Physical Therapy’s patient visits averaged 9.1% year-on-year growth. Because this number is lower than its revenue growth, we can see the company benefited from price increases. 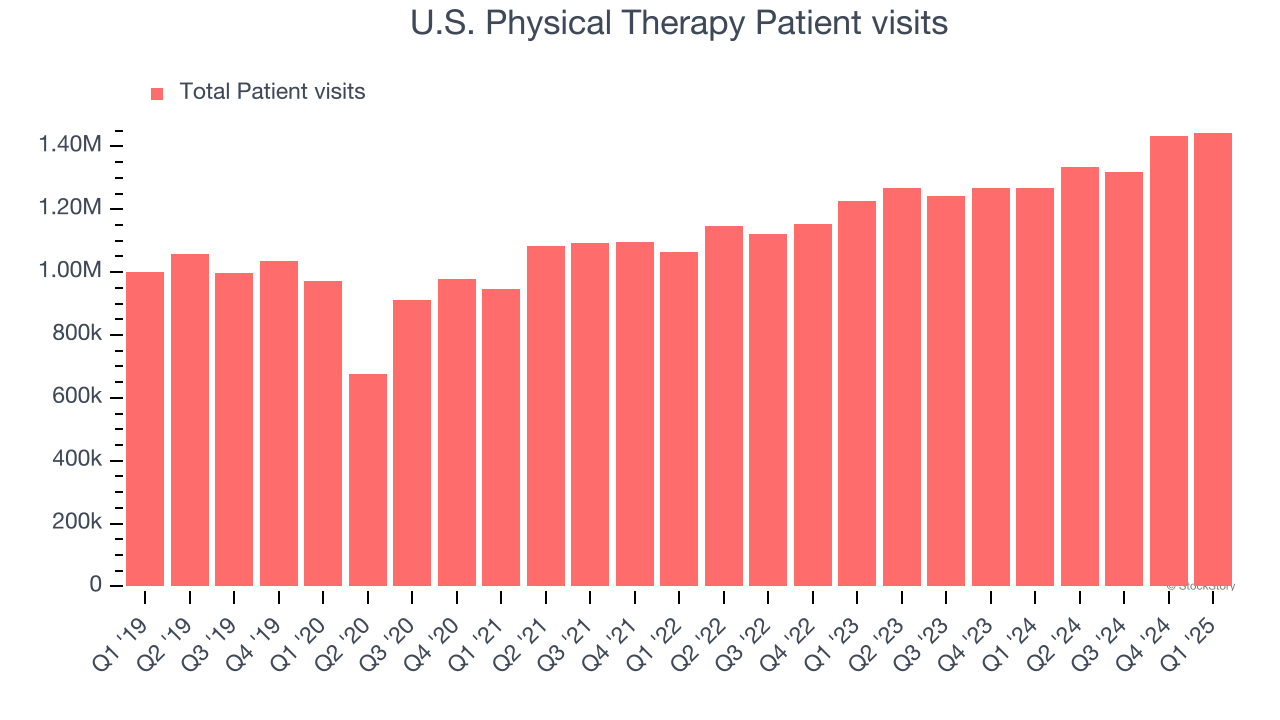
This quarter, U.S. Physical Therapy reported year-on-year revenue growth of 18.1%, and its $183.8 million of revenue exceeded Wall Street’s estimates by 4.4%.
Looking ahead, sell-side analysts expect revenue to grow 8.5% over the next 12 months, a slight deceleration versus the last two years. Still, this projection is commendable and implies the market sees success for its products and services.
Software is eating the world and there is virtually no industry left that has been untouched by it. That drives increasing demand for tools helping software developers do their jobs, whether it be monitoring critical cloud infrastructure, integrating audio and video functionality, or ensuring smooth content streaming. Click here to access a free report on our 3 favorite stocks to play this generational megatrend.
Operating Margin
Operating margin is one of the best measures of profitability because it tells us how much money a company takes home after subtracting all core expenses, like marketing and R&D.
U.S. Physical Therapy has done a decent job managing its cost base over the last five years. The company has produced an average operating margin of 11%, higher than the broader healthcare sector.
Analyzing the trend in its profitability, U.S. Physical Therapy’s operating margin decreased by 5.2 percentage points over the last five years. A silver lining is that on a two-year basis, its margin has stabilized. Still, shareholders will want to see U.S. Physical Therapy become more profitable in the future.
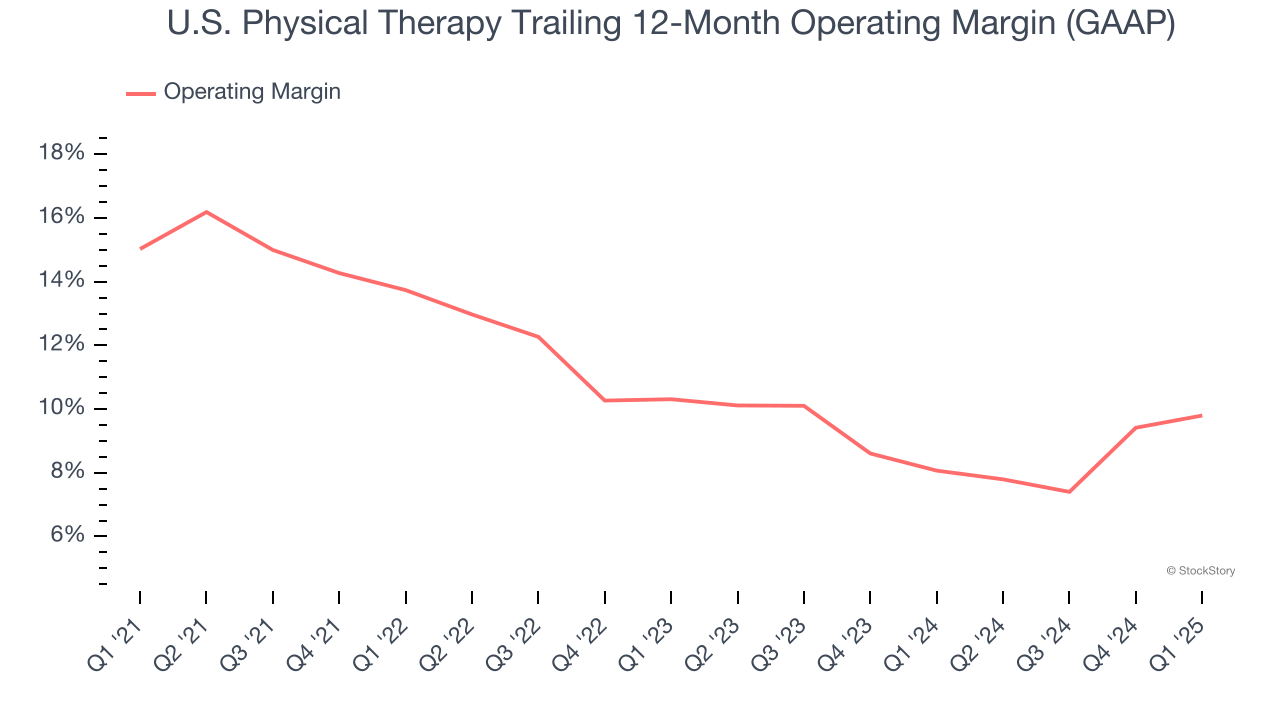
This quarter, U.S. Physical Therapy generated an operating profit margin of 10.7%, up 1.5 percentage points year on year. This increase was a welcome development and shows it was more efficient.
Earnings Per Share
We track the long-term change in earnings per share (EPS) for the same reason as long-term revenue growth. Compared to revenue, however, EPS highlights whether a company’s growth is profitable.
U.S. Physical Therapy’s flat EPS over the last five years was below its 7.9% annualized revenue growth. This tells us the company became less profitable on a per-share basis as it expanded.
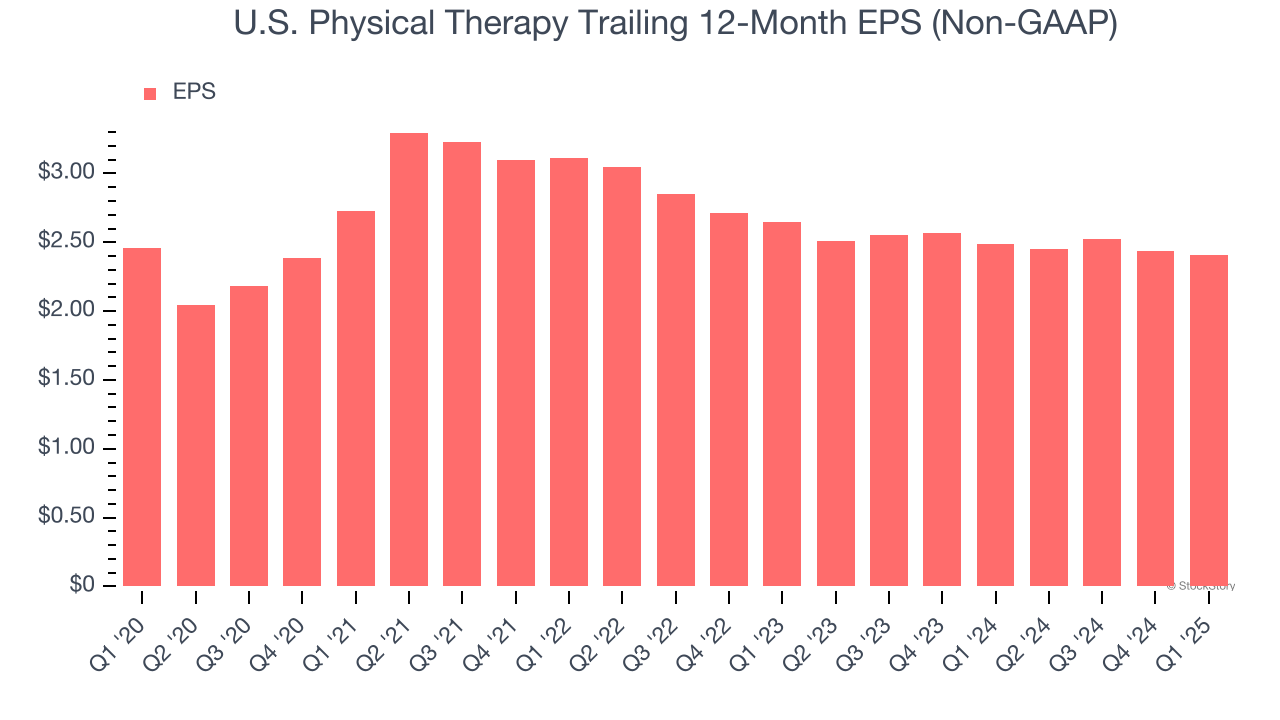
We can take a deeper look into U.S. Physical Therapy’s earnings to better understand the drivers of its performance. As we mentioned earlier, U.S. Physical Therapy’s operating margin improved this quarter but declined by 5.2 percentage points over the last five years. Its share count also grew by 18.3%, meaning the company not only became less efficient with its operating expenses but also diluted its shareholders. 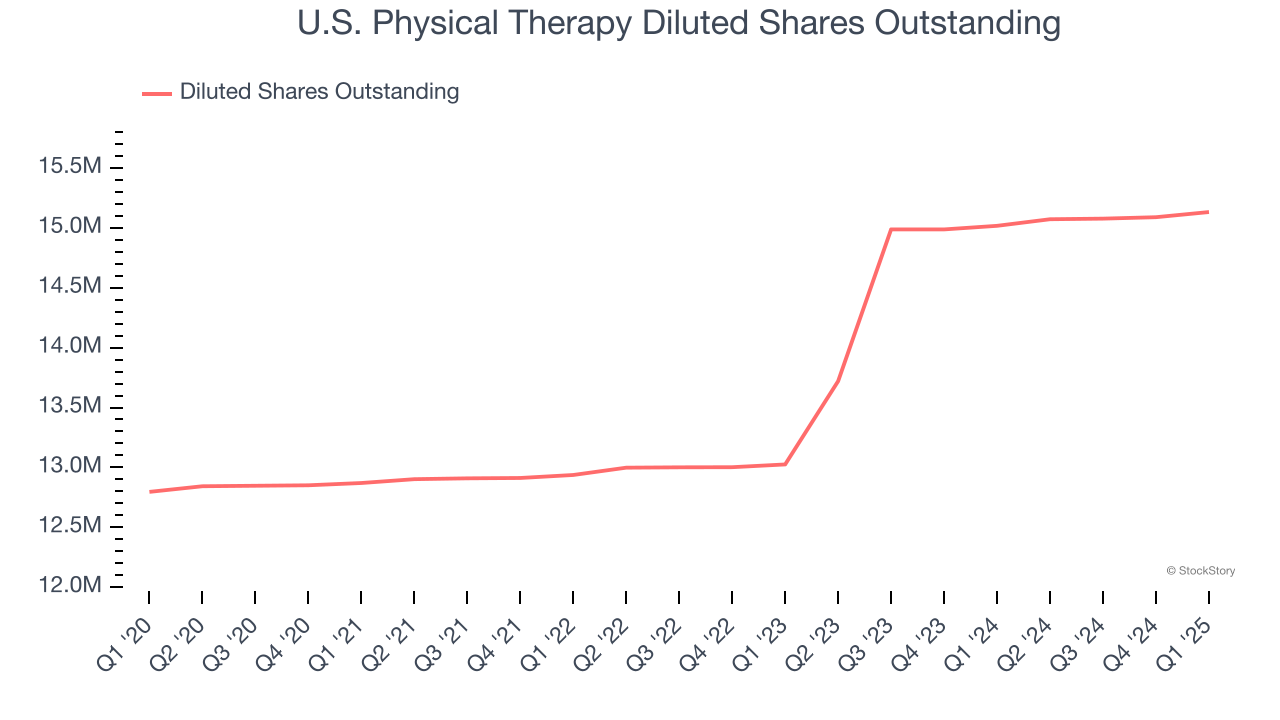
In Q1, U.S. Physical Therapy reported EPS at $0.48, down from $0.51 in the same quarter last year. Despite falling year on year, this print beat analysts’ estimates by 6.2%. Over the next 12 months, Wall Street expects U.S. Physical Therapy’s full-year EPS of $2.41 to grow 12%.
Key Takeaways from U.S. Physical Therapy’s Q1 Results
We enjoyed seeing U.S. Physical Therapy beat analysts’ revenue expectations this quarter. We were also glad its sales volume outperformed Wall Street’s estimates. Zooming out, we think this quarter featured some important positives. The stock remained flat at $70.96 immediately following the results.
U.S. Physical Therapy had an encouraging quarter, but one earnings result doesn’t necessarily make the stock a buy. Let’s see if this is a good investment. When making that decision, it’s important to consider its valuation, business qualities, as well as what has happened in the latest quarter. We cover that in our actionable full research report which you can read here, it’s free.