Wireless telecommunications provider Array (NYSE: AD) missed Wall Street’s revenue expectations in Q1 CY2026, with sales falling 94.2% year on year to $52.01 million. Its GAAP profit of $2.06 per share was 44.2% below analysts’ consensus estimates.
Is now the time to buy Array? Find out by accessing our full research report, it’s free.
Array (AD) Q1 CY2026 Highlights:
- Revenue: $52.01 million vs analyst estimates of $54.34 million (94.2% year-on-year decline, 4.3% miss)
- EPS (GAAP): $2.06 vs analyst expectations of $3.69 (44.2% miss)
- Adjusted EBITDA: $62.46 million vs analyst estimates of $50.4 million (120% margin, 23.9% beat)
- Operating Margin: 309%, up from 4.6% in the same quarter last year
- Free Cash Flow Margin: 19,234%, up from 9.9% in the same quarter last year
- Market Capitalization: $4.26 billion
"Array is executing on its 2026 priorities," said Anthony Carlson, President and CEO.
Company Overview
Operating as a majority-owned subsidiary of Telephone and Data Systems since its founding in 1983, Array (NYSE: AD) is a regional wireless telecommunications provider serving 4.6 million customers across 21 states with mobile phone, internet, and IoT services.
Revenue Growth
Reviewing a company’s long-term sales performance reveals insights into its quality. Even a bad business can shine for one or two quarters, but a top-tier one grows for years.
With $1.08 billion in revenue over the past 12 months, Array is a small player in the business services space, which sometimes brings disadvantages compared to larger competitors benefiting from economies of scale and numerous distribution channels.
As you can see below, Array’s demand was weak over the last five years. Its sales fell by 23.5% annually, a tough starting point for our analysis.
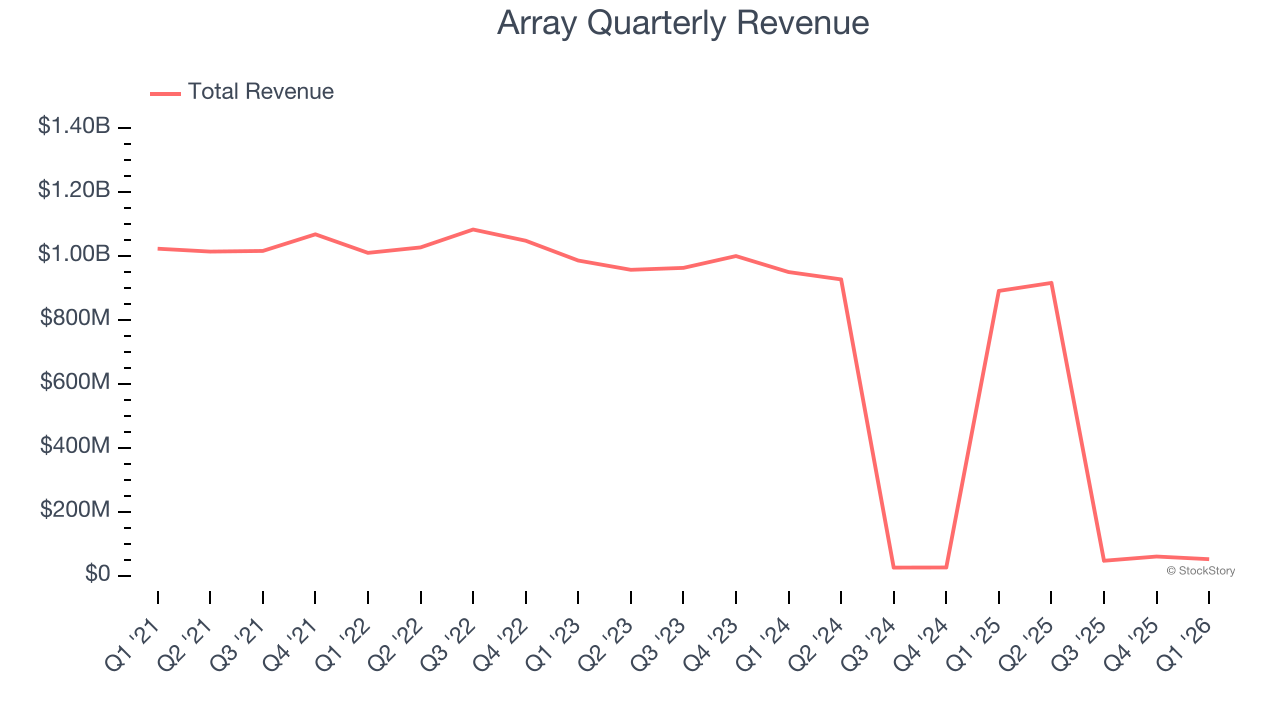
Long-term growth is the most important, but within business services, a half-decade historical view may miss new innovations or demand cycles. Array’s recent performance shows its demand remained suppressed as its revenue has declined by 47.3% annually over the last two years. 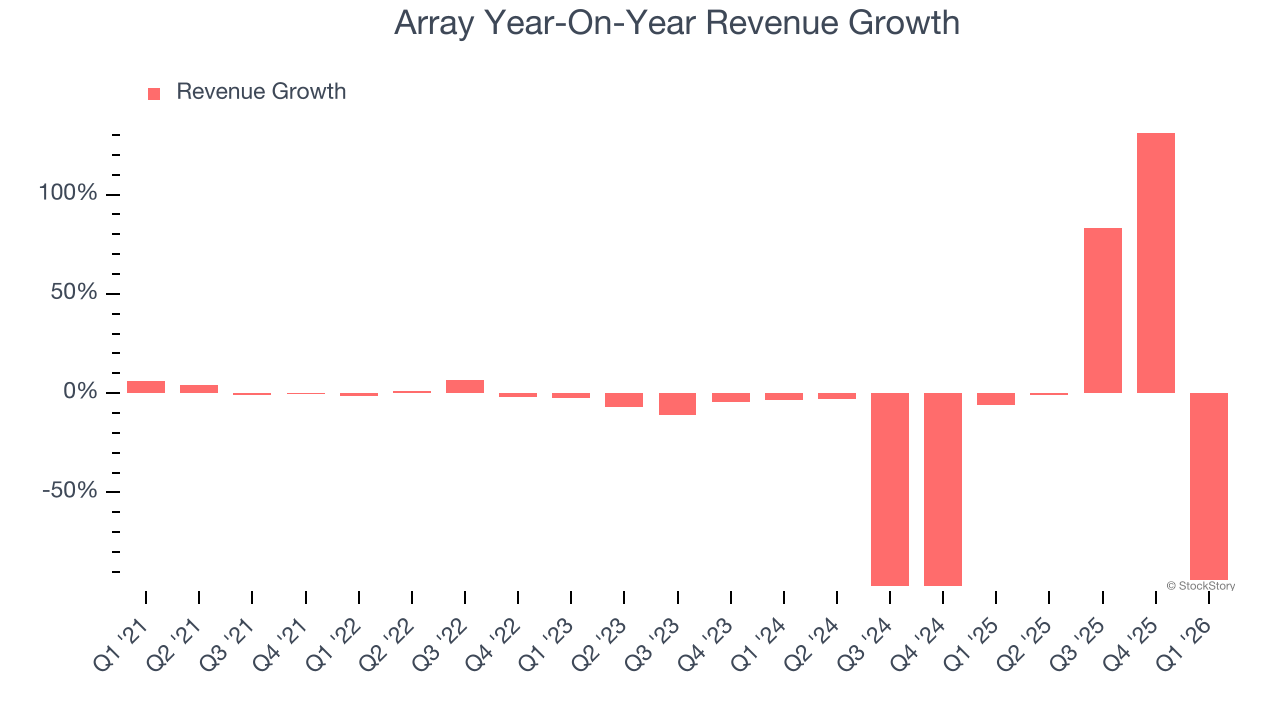
This quarter, Array missed Wall Street’s estimates and reported a rather uninspiring 94.2% year-on-year revenue decline, generating $52.01 million of revenue.
Looking ahead, sell-side analysts expect revenue to decline by 81% over the next 12 months, a deceleration versus the last two years. This projection is underwhelming and implies its products and services will see some demand headwinds.
ONE MORE THING: The $21 AI Application Stock Wall Street Forgot. While Wall Street obsesses over who’s building AI, one company is already using it to print money. And nobody’s paying attention.
AI chip stocks trade at ridiculous valuations. This company processes a trillion consumer signals monthly using AI and trades at a third of the price. The gap won’t last. The institutions will figure it out. You need to see this first. Read the FREE Report Before They Notice.
Adjusted Operating Margin
Adjusted operating margin is an important measure of profitability as it shows the portion of revenue left after accounting for all core expenses – everything from the cost of goods sold to advertising and wages. It’s also useful for comparing profitability across companies because it excludes non-recurring expenses, interest on debt, and taxes.
Array was profitable over the last five years but held back by its large cost base. Its average adjusted operating margin of 4% was weak for a business services business.
On the plus side, Array’s adjusted operating margin rose by 31.3 percentage points over the last five years.
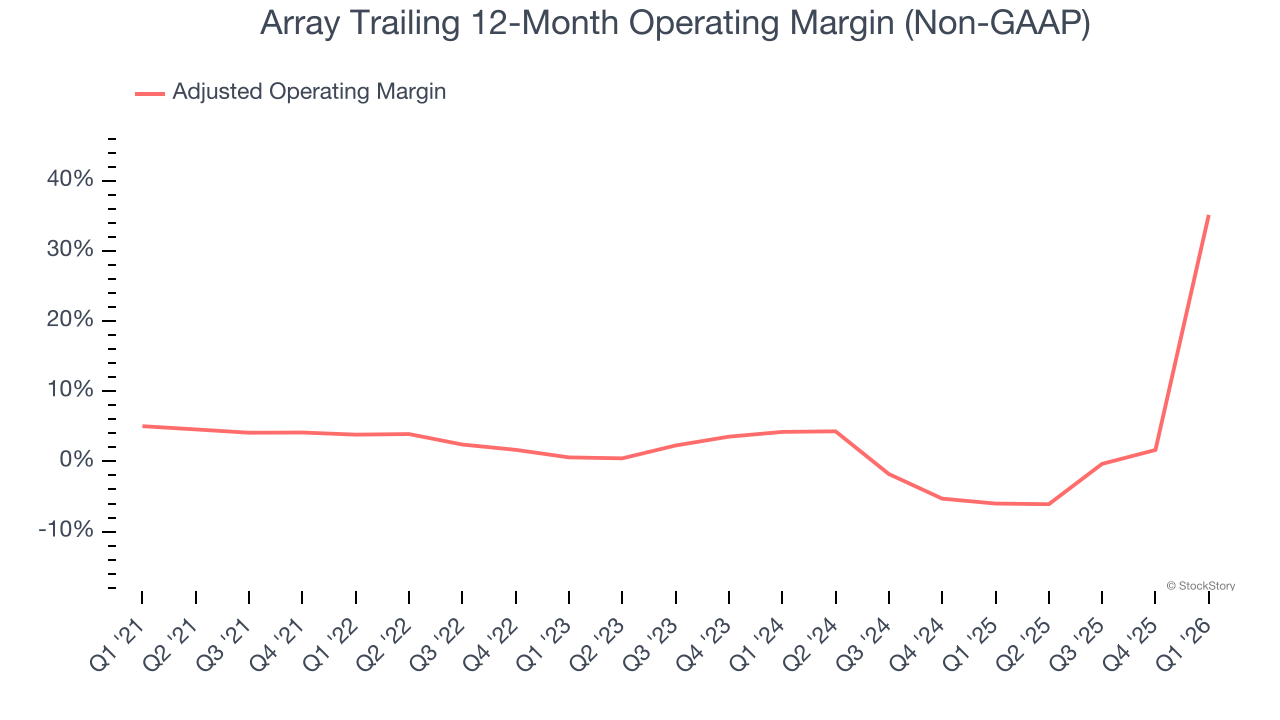
This quarter, Array generated an adjusted operating margin profit margin of 746%, up 741 percentage points year on year. This increase was a welcome development, especially since its revenue fell, showing it was more efficient because it scaled down its expenses.
Earnings Per Share
We track the long-term change in earnings per share (EPS) for the same reason as long-term revenue growth. Compared to revenue, however, EPS highlights whether a company’s growth is profitable.
Array’s flat EPS over the last five years was weak but better than its 23.5% annualized revenue declines. This tells us management adapted its cost structure.
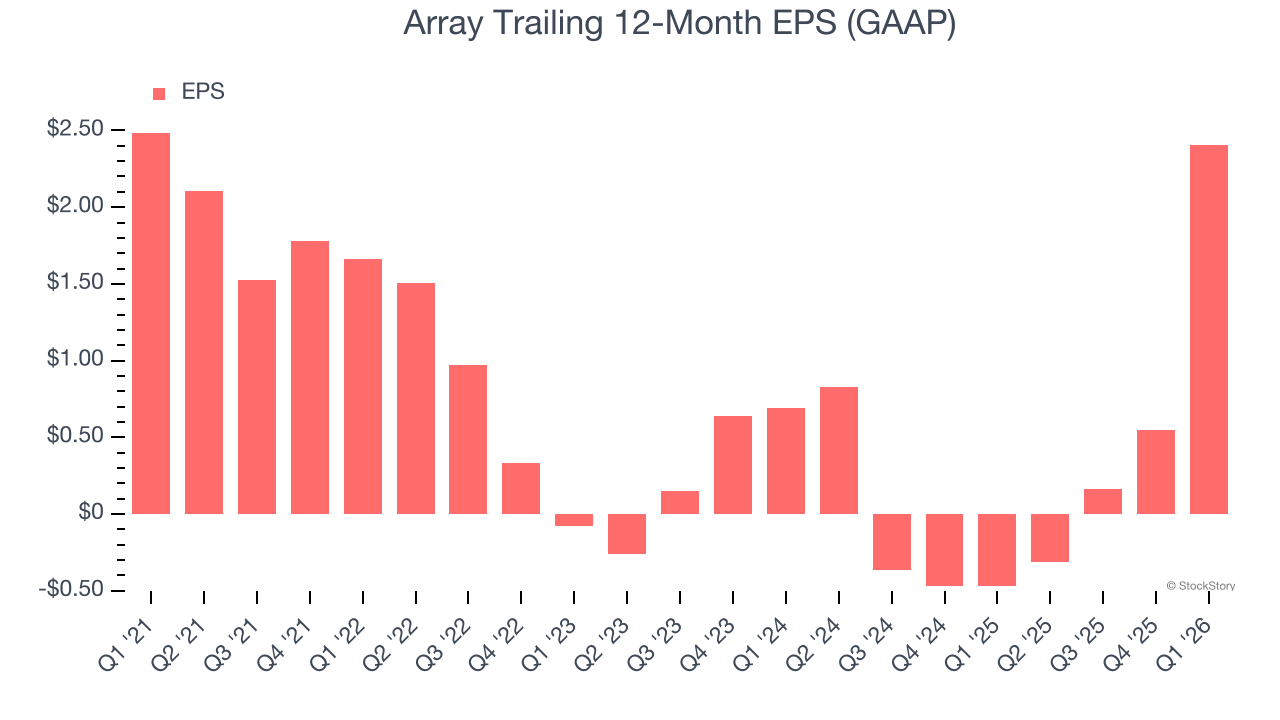
Diving into the nuances of Array’s earnings can give us a better understanding of its performance. As we mentioned earlier, Array’s adjusted operating margin expanded by 31.3 percentage points over the last five years. On top of that, its share count shrank by 1.7%. These are positive signs for shareholders because improving profitability and share buybacks turbocharge EPS growth relative to revenue growth. 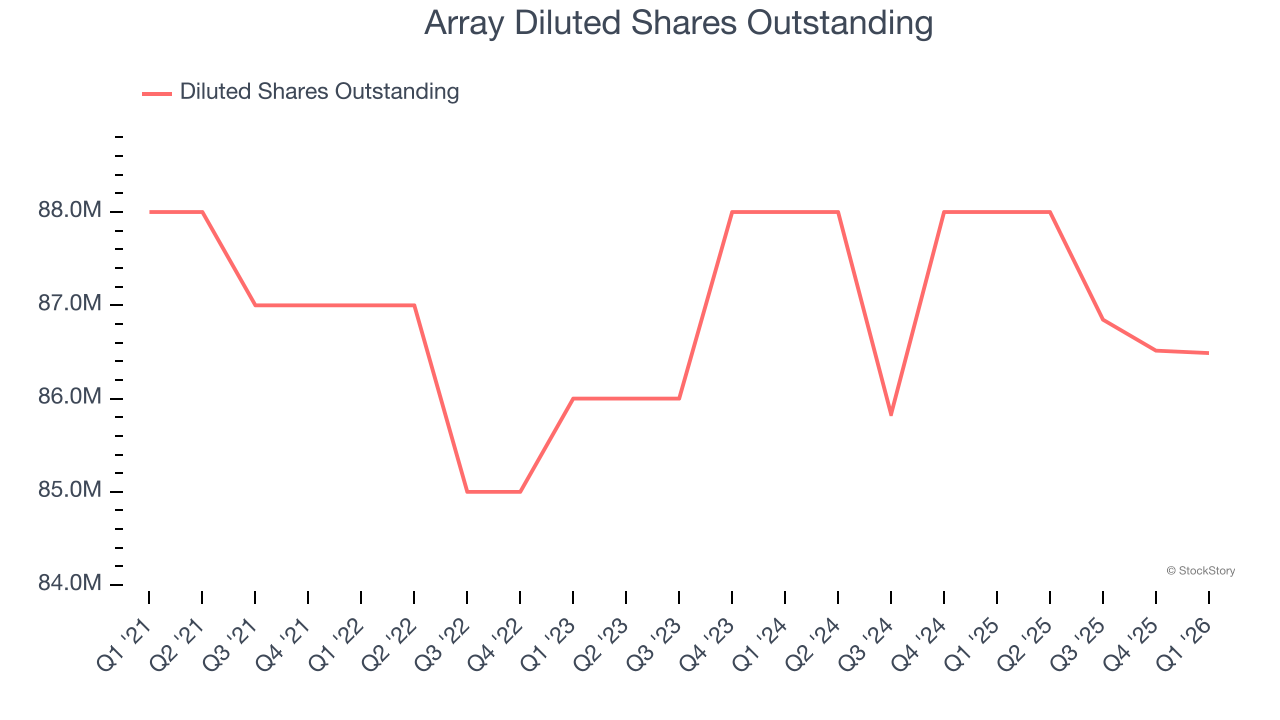
Like with revenue, we analyze EPS over a shorter period to see if we are missing a change in the business.
For Array, its two-year annual EPS growth of 86.7% was higher than its five-year trend. This acceleration made it one of the faster-growing business services companies in recent history.
In Q1, Array reported EPS of $2.06, up from $0.20 in the same quarter last year. Despite growing year on year, this print missed analysts’ estimates. Over the next 12 months, Wall Street expects Array’s full-year EPS of $2.40 to grow 31.3%. This is unusual as its revenue and operating margin are anticipated to fall, signaling the increase likely stems from "below-the-line" items such as taxes.
Key Takeaways from Array’s Q1 Results
We struggled to find many positives in these results. Its revenue missed and its EPS fell short of Wall Street’s estimates. Overall, this was a weaker quarter. The stock traded up 2.1% to $50.34 immediately following the results.
So do we think Array is an attractive buy at the current price? If you’re making that decision, you should consider the bigger picture of valuation, business qualities, as well as the latest earnings. We cover that in our actionable full research report which you can read here (it’s free).