
Specialty products refiner Calumet (NASDAQ: CLMT) beat Wall Street’s revenue expectations in Q1 CY2026, with sales up 3.6% year on year to $1.03 billion. Its GAAP loss of $3.64 per share was significantly below analysts’ consensus estimates.
Is now the time to buy Calumet? Find out by accessing our full research report, it’s free.
Calumet (CLMT) Q1 CY2026 Highlights:
- Revenue: $1.03 billion vs analyst estimates of $953.4 million (3.6% year-on-year growth, 8% beat)
- EPS (GAAP): -$3.64 vs analyst estimates of -$0.57 (significant miss due to an unrealized loss of $102.7 million for derivatives,)
- Adjusted EBITDA: $50.1 million vs analyst estimates of $71.8 million (4.9% margin, 30.2% miss due to an unrealized loss of $102.7 million for derivatives,)
- Operating Margin: -16.6%, down from -4.9% in the same quarter last year
- Free Cash Flow was -$99.4 million compared to -$128.2 million in the same quarter last year
- Market Capitalization: $3 billion
"The first quarter of 2026 marked a pivotal moment in Calumet's transformation," said Todd Borgmann, CEO.
Company Overview
With roots dating back to 1919 and facilities strategically positioned from Louisiana to Montana, Calumet (NASDAQ: CLMT) refines crude oil into specialty products like lubricating oils, solvents, and waxes used in cosmetics, batteries, and industrial applications.
Revenue Growth
Cyclical sectors like Energy often flatter weaker operators during favorable price environments, but a longer-term lens separates those from businesses that can consistently perform across market cycles. Thankfully, Calumet’s 13.9% annualized revenue growth over the last five years was solid. Its growth beat the average energy upstream and integrated energy company and shows its offerings resonate with customers.
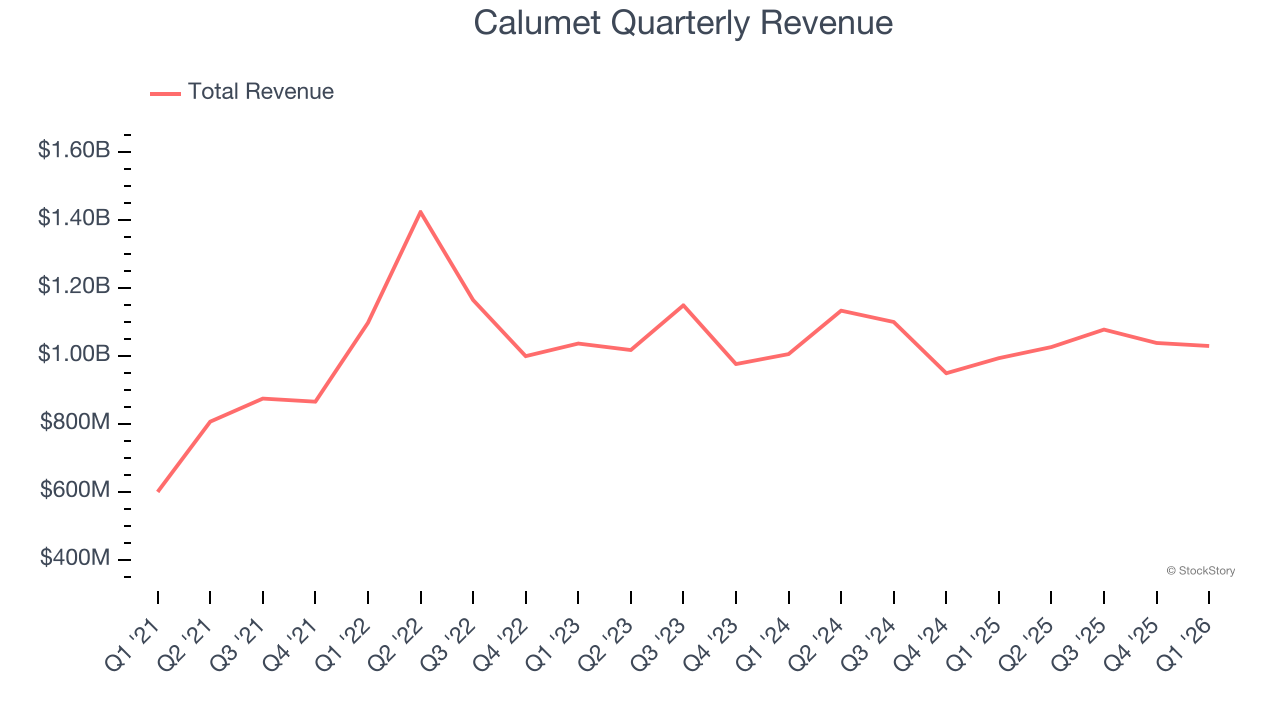
Energy cycles can be long enough that a single five-year period can still reflect one price environment, which is why an additional, decade-long view can help capture through-cycle performance. Calumet’s annualized revenue growth of 0.7% over the last ten years is below its five-year trend, but we still think the results were respectable.
This quarter, Calumet reported modest year-on-year revenue growth of 3.6% but beat Wall Street’s estimates by 8%.
WHILE YOU’RE HERE: The Next Palantir? One satellite company captures images of every point on Earth. Every single day. The Pentagon wants it. Hedge funds are using it to beat earnings. You’ve probably never heard of it.
This is what the early days of Palantir looked like before it became a $437 billion giant. Same playbook. Different technology. If you missed Palantir, you need to see this. Claim The Stock Ticker for Free HERE.
Adjusted EBITDA Margin
Adjusted EBITDA margin is an important measure of profitability for the sector and accounts for the gross margins and operating costs mentioned previously. Unlike operating margin, it is not distorted by accounting conventions around reserves, drilling costs, and assumptions on commodity consumption from the well or basin. Adjusted EBITDA highlights the economic reality of how much cash the rock produces before the capital structure (debt service) and the drilling budget (capex) are considered.
Calumet was profitable over the last five years but held back by its large cost base. Its average EBITDA margin of 6.4% was among the worst in the energy upstream and integrated energy sector.
On the plus side, Calumet’s EBITDA margin rose by 3.1 percentage points over the last year.
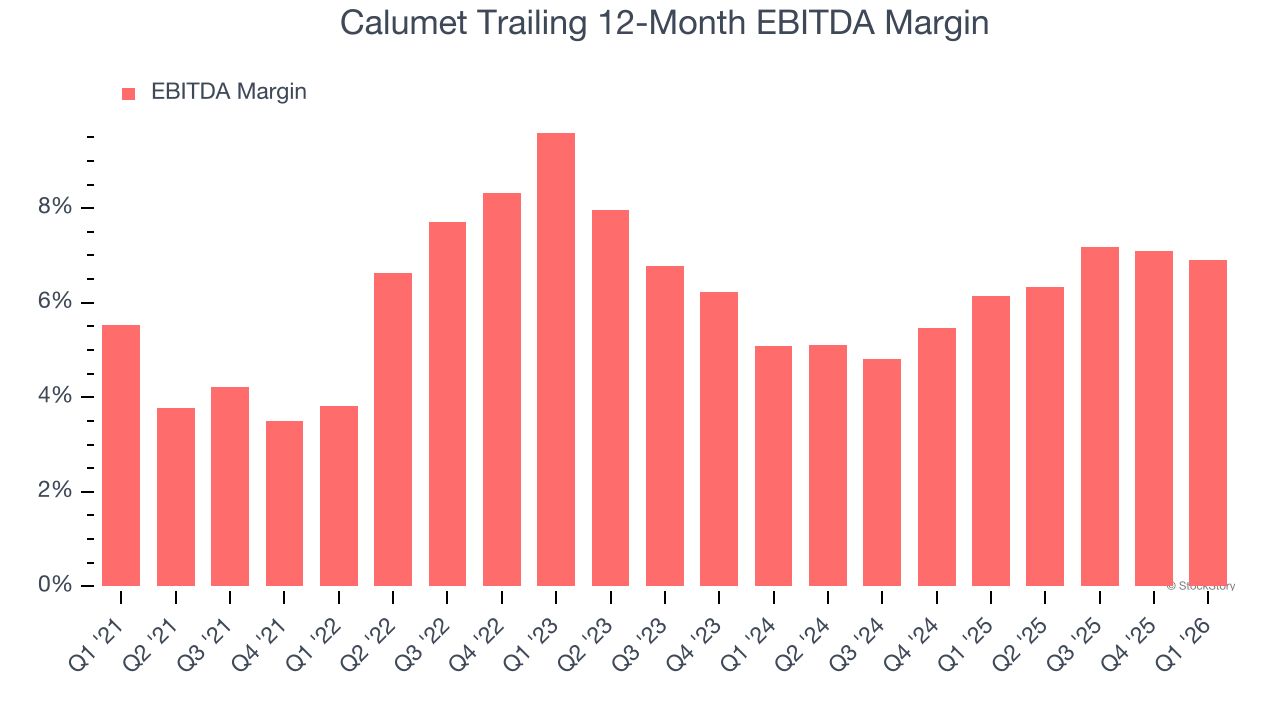
In Q1, Calumet generated an EBITDA margin profit margin of 4.9%, in line with the same quarter last year. This indicates the company’s overall cost structure has been relatively stable. This adjusted EBITDA fell short of Wall Street’s estimates.
Cash Is King
Adjusted EBITDA shows how profitable a company’s existing wells are before financing and reinvestment decisions, but free cash flow shows how much value remains after paying the cost of replacing those wells. In upstream energy, production naturally declines over time, so companies must continuously reinvest just to stand still. A producer can report strong EBITDA margins yet generate little or no free cash flow if its wells decline quickly or if new drilling is expensive. Free cash flow therefore captures not only how efficiently a company produces hydrocarbons today, but also how costly it is to sustain that production into the future.
Calumet’s demanding reinvestments have consumed many resources over the last five years, contributing to an average free cash flow margin of negative 4.6%. This means it lit $4.62 of cash on fire for every $100 in revenue.
While the level of free cash flow margins is important, their consistency matters just as much.
Calumet’s ratio of quarterly free cash flow volatility to WTI crude price volatility over the past five years was 11.5 (lower is better), indicating that its cash generation is far more sensitive to commodity-price swings than most peers. This elevated volatility limits its access to capital in downturns and makes it unlikely to act as a consolidator when weaker competitors come under pressure.
You may be asking why we wait until the free cash flow line to perform this stability analysis versus commodity prices. Why not compare revenue or EBITDA to WTI in the case of Calumet? Because what ultimately matters is not how much revenue or profit you earn when prices are high but how much cash you can generate when prices are low. Free cash flow is the superior metric because it includes everything from hedging prowess to growth and maintenance capex to management behavior during good times and bad.
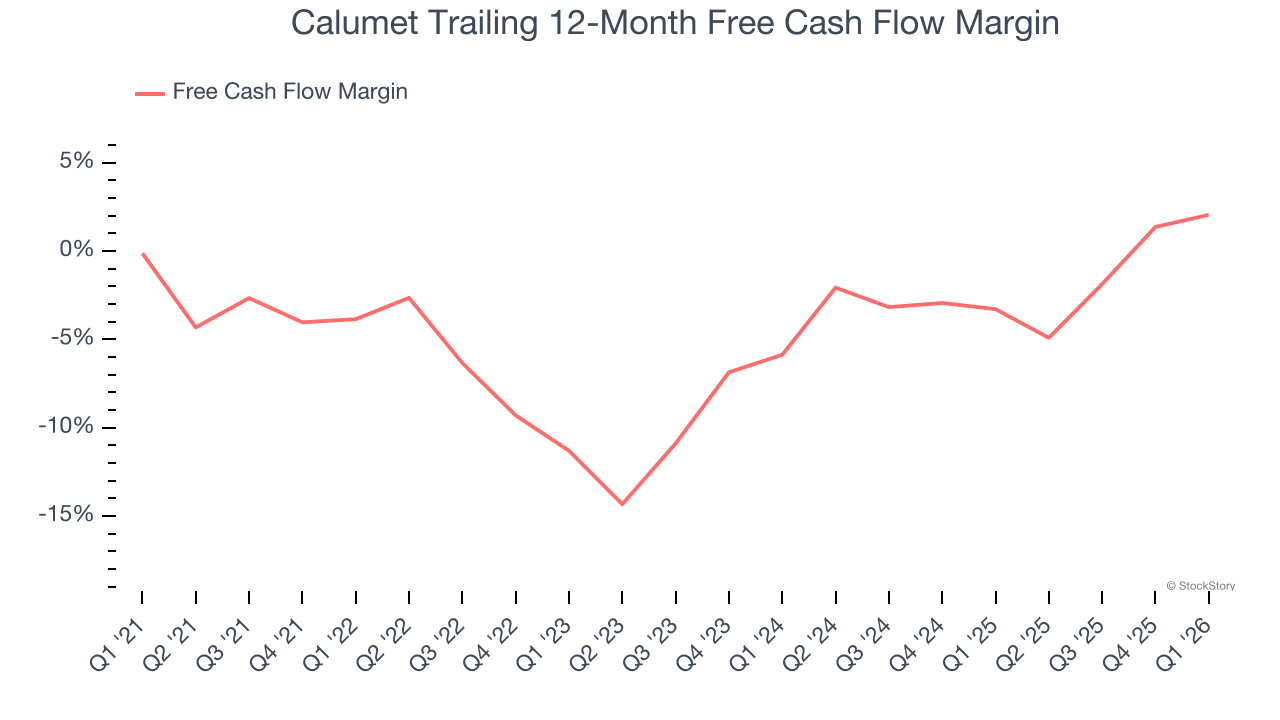
Calumet burned through $99.4 million of cash in Q1, equivalent to a negative 9.7% margin. The company’s cash burn slowed from $128.2 million of lost cash in the same quarter last year.
Key Takeaways from Calumet’s Q1 Results
We were impressed by how significantly Calumet blew past analysts’ revenue expectations this quarter. On the other hand, its EBITDA missed and its EPS fell short of Wall Street’s estimates, although this was largely due to an unrealized loss of $102.7 million for derivatives,. The stock remained flat at $34.75 immediately after reporting.
So should you invest in Calumet right now? We think that the latest quarter is only one piece of the longer-term business quality puzzle. Quality, when combined with valuation, can help determine if the stock is a buy. We cover that in our actionable full research report which you can read here (it’s free).


