Restaurant company Cracker Barrel (NASDAQ: CBRL) reported Q1 CY2026 results topping the market’s revenue expectations, but sales fell by 2.9% year on year to $797.4 million. The company’s full-year revenue guidance of $3.29 billion at the midpoint came in 1.1% above analysts’ estimates. Its non-GAAP profit of $0.29 per share was significantly above analysts’ consensus estimates.
Is now the time to buy Cracker Barrel? Find out by accessing our full research report, it’s free.
Cracker Barrel (CBRL) Q1 CY2026 Highlights:
- Revenue: $797.4 million vs analyst estimates of $776.7 million (2.9% year-on-year decline, 2.7% beat)
- Adjusted EPS: $0.29 vs analyst estimates of -$0.48 (significant beat)
- Adjusted EBITDA: $40.31 million vs analyst estimates of $23.54 million (5.1% margin, 71.2% beat)
- The company slightly lifted its revenue guidance for the full year to $3.29 billion at the midpoint from $3.26 billion
- EBITDA guidance for the full year is $122.5 million at the midpoint, above analyst estimates of $92.68 million
- Operating Margin: 0.8%, in line with the same quarter last year
- Free Cash Flow was $67.53 million, up from -$13.24 million in the same quarter last year
- Locations: 709 at quarter end, down from 728 in the same quarter last year
- Market Capitalization: $764.6 million
Cracker Barrel President and Chief Executive Officer Julie Masino said, "Our initiatives to improve operations, deepen guest connection, and enhance profitability continue to gain traction, with strong execution from our teams driving third quarter results that exceeded expectations. We remain focused on serving delicious food and delivering experiences guests love and believe we are well-positioned to sustain this new momentum."
Company Overview
Known for its country-themed food and merchandise, Cracker Barrel (NASDAQ: CBRL) is a beloved American restaurant and retail chain that celebrates the warmth and charm of Southern hospitality.
Revenue Growth
A company’s long-term sales performance can indicate its overall quality. Even a bad business can shine for one or two quarters, but a top-tier one grows for years.
With $3.34 billion in revenue over the past 12 months, Cracker Barrel is one of the larger restaurant chains in the industry and benefits from a well-known brand that influences consumer purchasing decisions. However, its scale is a double-edged sword because it’s harder to find incremental growth when your existing restaurant banners have penetrated most of the market. To accelerate system-wide sales, Cracker Barrel likely needs to optimize its pricing or lean into new chains and international expansion.
As you can see below, Cracker Barrel grew its sales at a weak 1.1% compounded annual growth rate over the last seven years as it didn’t open many new restaurants.
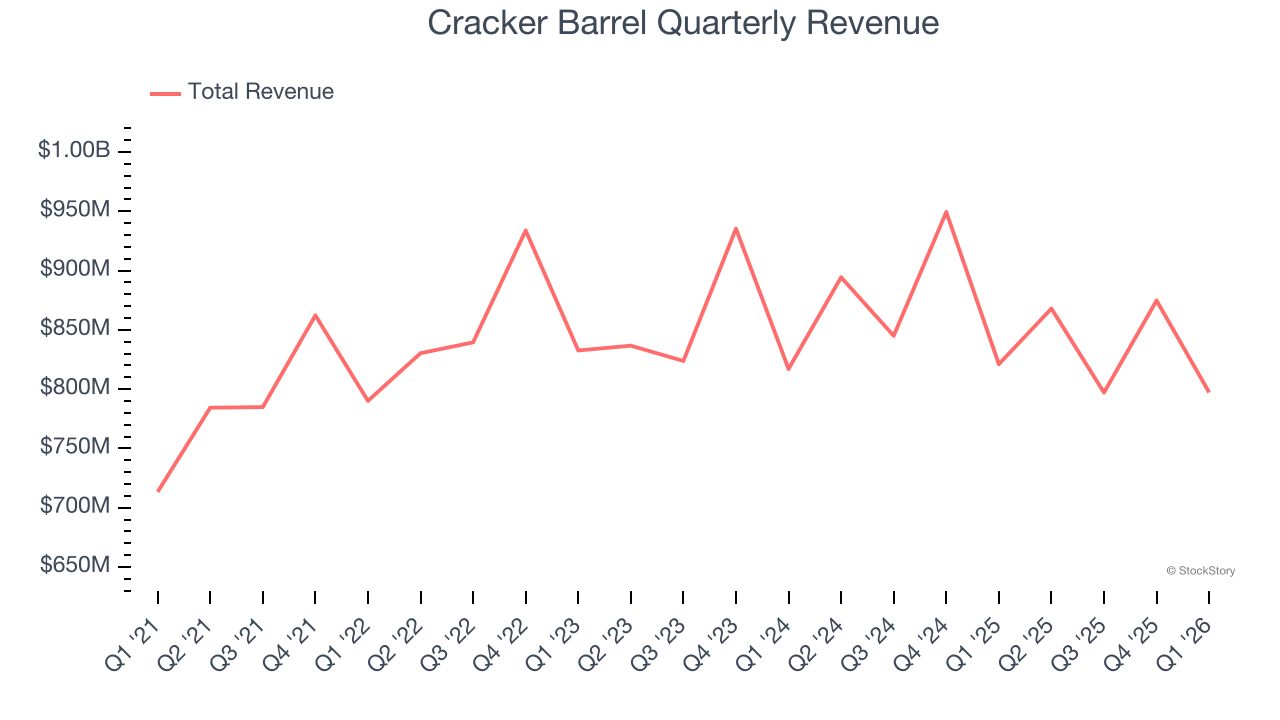
This quarter, Cracker Barrel’s revenue fell by 2.9% year on year to $797.4 million but beat Wall Street’s estimates by 2.7%.
Looking ahead, sell-side analysts expect revenue to remain flat over the next 12 months. This projection is underwhelming and implies its menu offerings will see some demand headwinds.
ONE MORE THING: The $21 AI Application Stock Wall Street Forgot. While Wall Street obsesses over who’s building AI, one company is already using it to print money. And nobody’s paying attention.
AI chip stocks trade at ridiculous valuations. This company processes a trillion consumer signals monthly using AI and trades at a third of the price. The gap won’t last. The institutions will figure it out. You need to see this first. Read the FREE Report Before They Notice.
Restaurant Performance
Number of Restaurants
A restaurant chain’s total number of dining locations influences how much it can sell and how quickly revenue can grow.
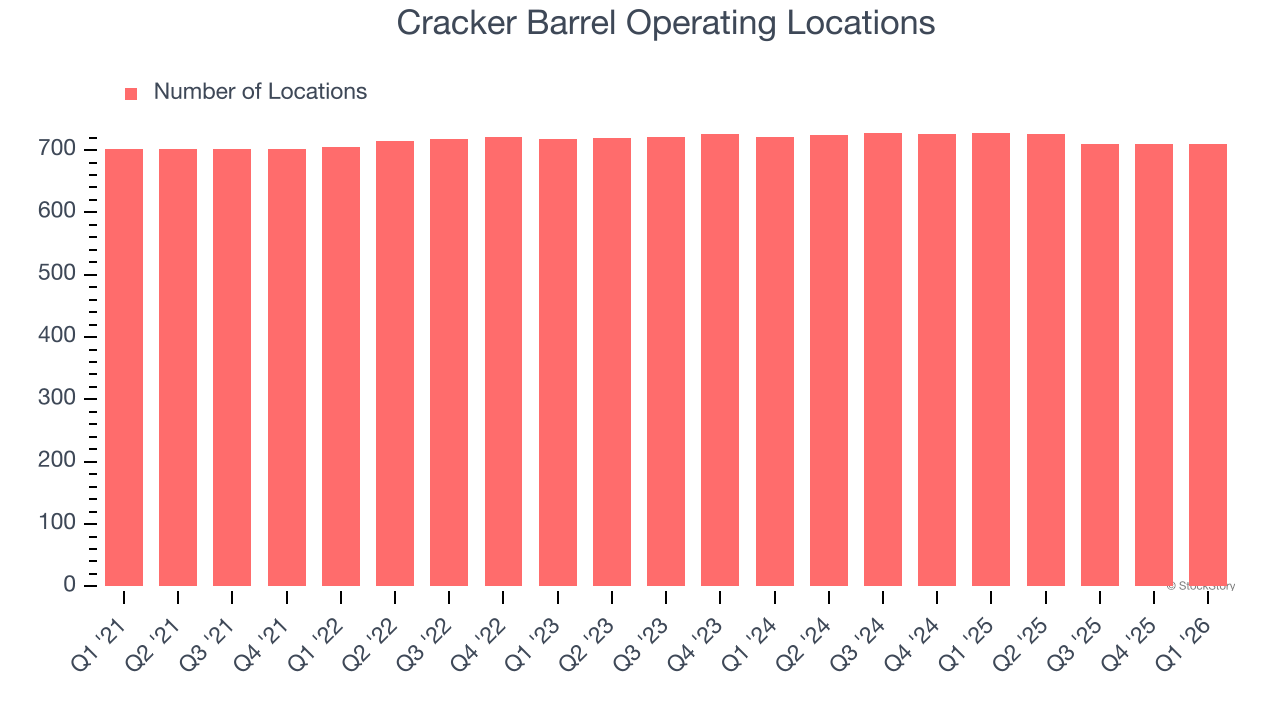
Cracker Barrel operated 709 locations in the latest quarter, and over the last two years, has kept its restaurant count flat while other restaurant businesses have opted for growth.
When a chain doesn’t open many new restaurants, it usually means there’s stable demand for its meals and it’s focused on improving operational efficiency to increase profitability.
Same-Store Sales
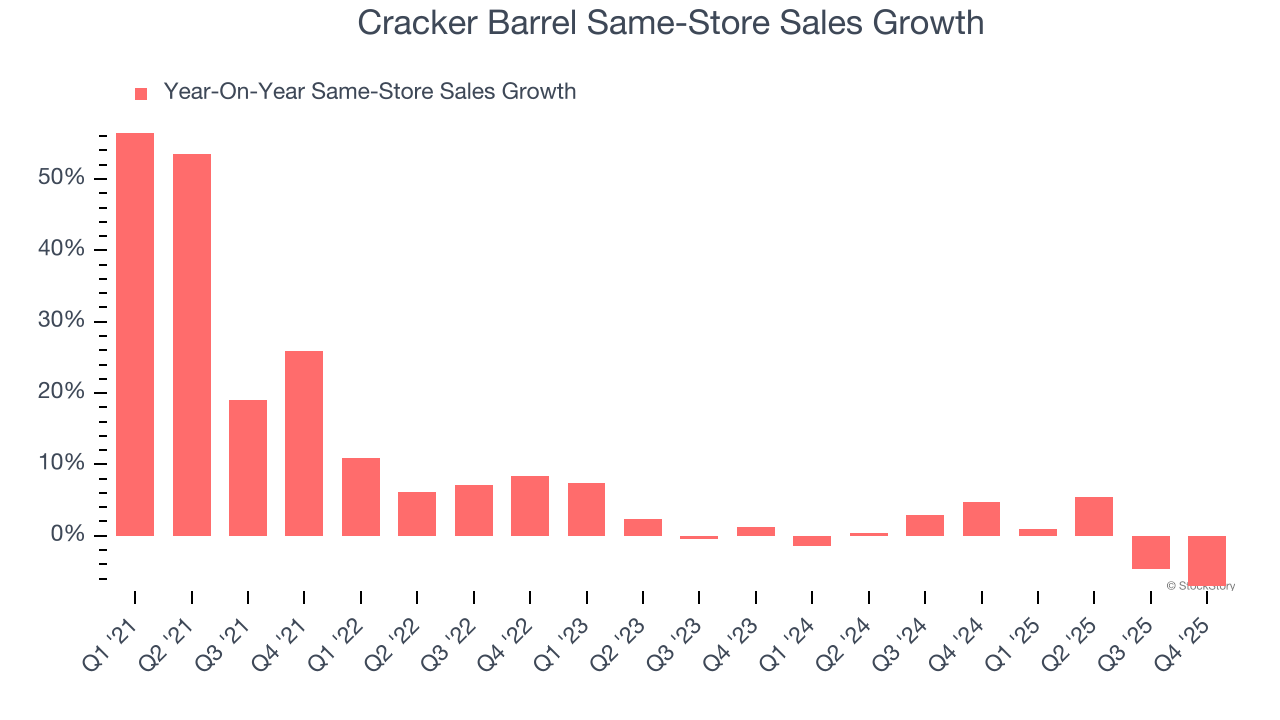
A company’s restaurant base only paints one part of the picture. When demand is high, it makes sense to open more. But when demand is low, it’s prudent to close some locations and use the money in other ways. Same-store sales gives us insight into this topic because it measures organic growth at restaurants open for at least a year.
Cracker Barrel’s demand within its existing dining locations has barely increased over the last two years as its same-store sales were flat. This performance isn’t ideal, and we’d be skeptical if Cracker Barrel starts opening new restaurants to artificially boost revenue growth.
Note that Cracker Barrel reports its same-store sales intermittently, so some data points are missing in the chart below.
Key Takeaways from Cracker Barrel’s Q1 Results
It was good to see Cracker Barrel beat analysts’ EPS expectations this quarter. We were also excited its EBITDA outperformed Wall Street’s estimates by a wide margin. Zooming out, we think this was a solid print. The stock traded up 11.7% to $40.67 immediately following the results.
Cracker Barrel had an encouraging quarter, but one earnings result doesn’t necessarily make the stock a buy. Let’s see if this is a good investment. If you’re making that decision, you should consider the bigger picture of valuation, business qualities, as well as the latest earnings. We cover that in our actionable full research report which you can read here (it’s free).