Welding and cutting equipment manufacturer ESAB (NYSE: ESAB) reported Q2 CY2026 results topping the market’s revenue expectations, with sales up 12.9% year on year to $807.6 million. Its non-GAAP profit of $1.33 per share was 3% below analysts’ consensus estimates.
Is now the time to buy ESAB? Find out by accessing our full research report, it’s free.
ESAB (ESAB) Q2 CY2026 Highlights:
- Revenue: $807.6 million vs analyst estimates of $787.2 million (12.9% year-on-year growth, 2.6% beat)
- Adjusted EPS: $1.33 vs analyst expectations of $1.37 (3% miss)
- Adjusted EBITDA: $149.6 million vs analyst estimates of $150.2 million (18.5% margin, in line)
- Adjusted EPS guidance for the full year is $5.45 at the midpoint, missing analyst estimates by 4.4%
- EBITDA guidance for the full year is $620 million at the midpoint, in line with analyst expectations
- Operating Margin: 9.7%, down from 15.2% in the same quarter last year
- Free Cash Flow Margin: 1.9%, down from 5.2% in the same quarter last year
- Organic Revenue rose 2.5% year on year (beat)
- Market Capitalization: $5.75 billion
Company Overview
Having played a significant role in the construction of the iconic Sydney Opera House, ESAB (NYSE: ESAB) manufactures and sells welding and cutting equipment for numerous industries.
Revenue Growth
Reviewing a company’s long-term sales performance reveals insights into its quality. Any business can experience short-term success, but top-performing ones enjoy sustained growth for years. Regrettably, ESAB’s sales grew at a tepid 5.3% compounded annual growth rate over the last five years. This fell short of our benchmark for the industrials sector and is a tough starting point for our analysis.
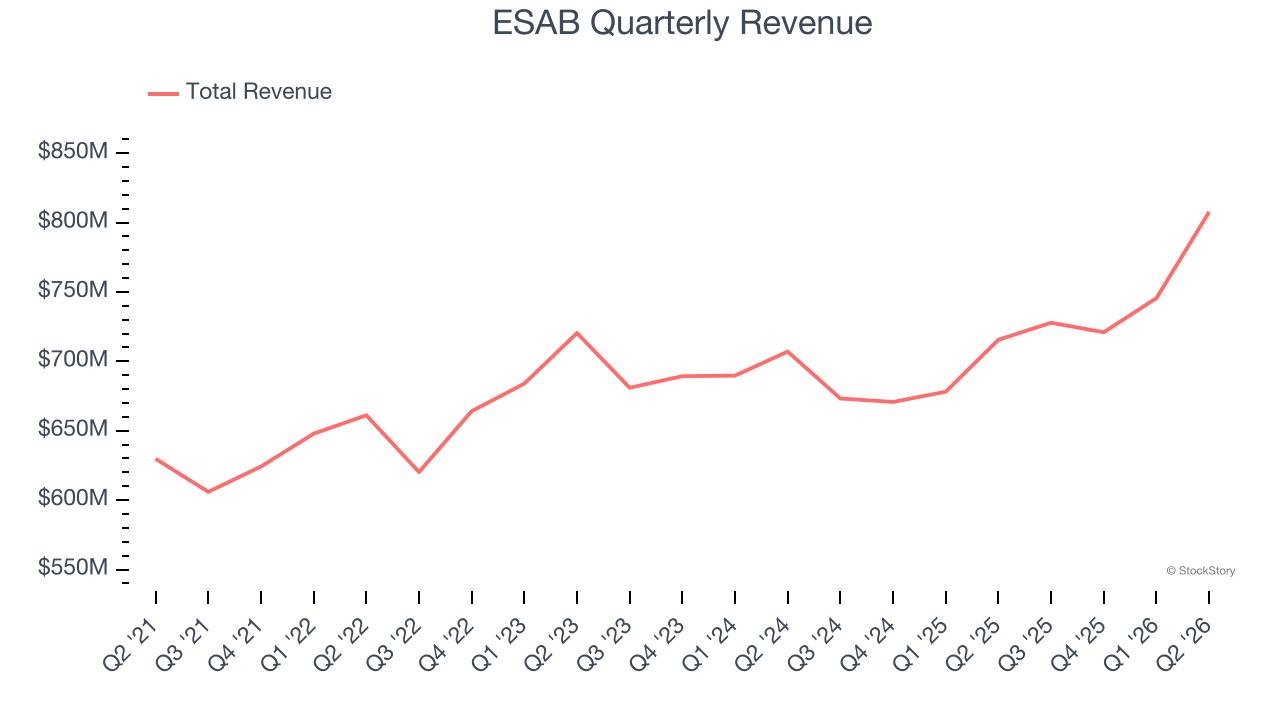
Long-term growth is the most important, but within industrials, a half-decade historical view may miss new industry trends or demand cycles. ESAB’s recent performance shows its demand has slowed as its annualized revenue growth of 4.2% over the last two years was below its five-year trend. We’re wary when companies in the sector see decelerations in revenue growth, as it could signal changing consumer tastes aided by low switching costs. 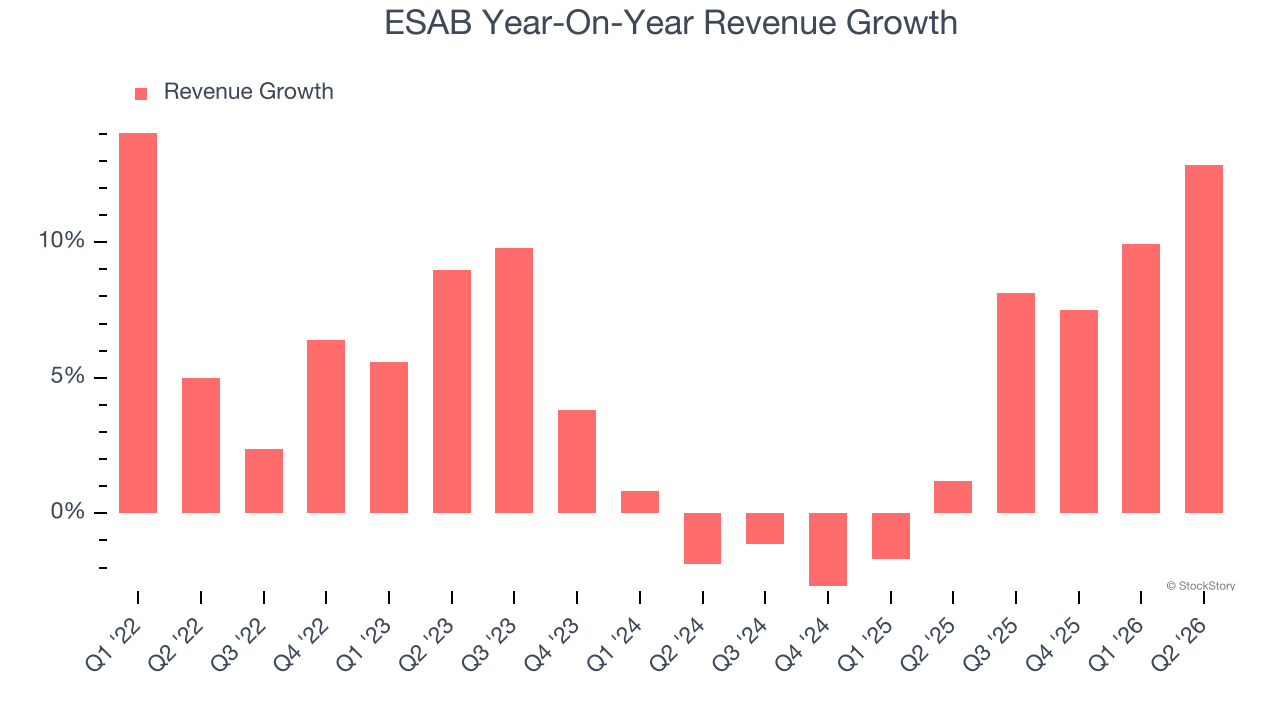
We can dig further into the company’s sales dynamics by analyzing its organic revenue, which strips out one-time events like acquisitions and currency fluctuations that don’t accurately reflect its fundamentals. Over the last two years, ESAB’s organic revenue was flat. Because this number is lower than its two-year revenue growth, we can see that some mixture of acquisitions and foreign exchange rates boosted its headline results. 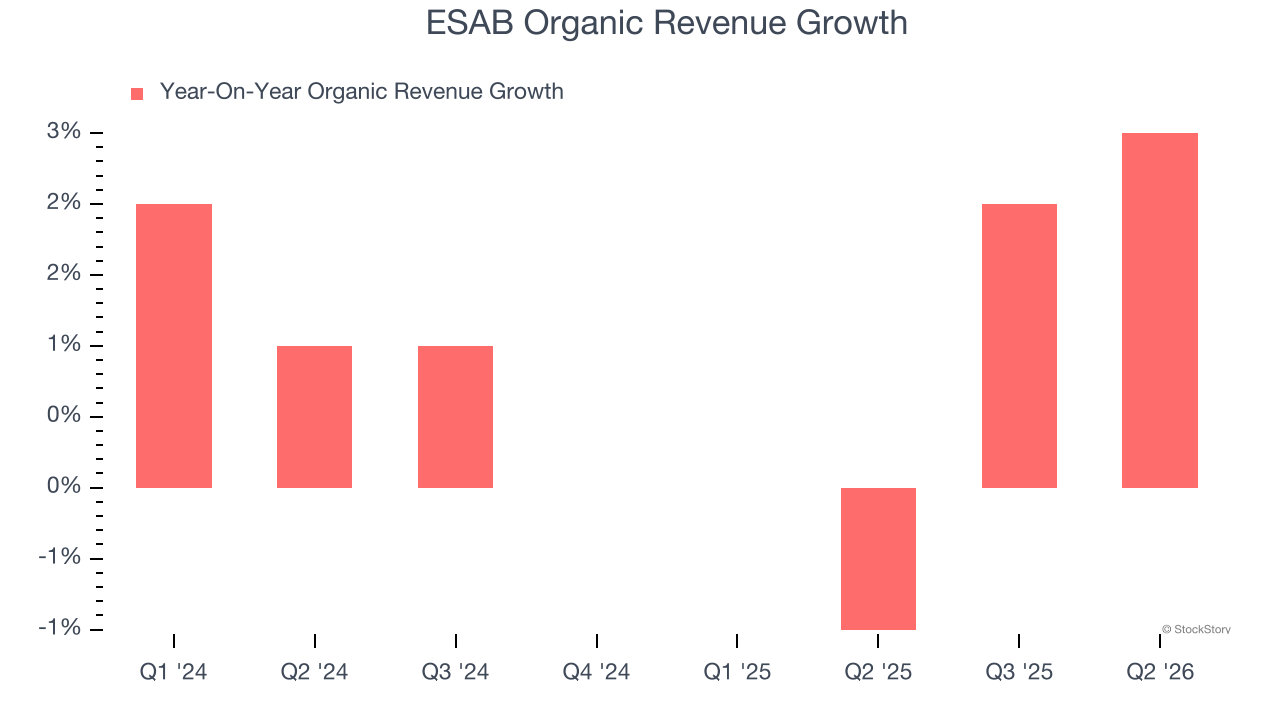
This quarter, ESAB reported year-on-year revenue growth of 12.9%, and its $807.6 million of revenue exceeded Wall Street’s estimates by 2.6%.
Looking ahead, sell-side analysts expect revenue to grow 13.2% over the next 12 months, an improvement versus the last two years. This projection is noteworthy and suggests its newer products and services will catalyze better top-line performance.
WHILE YOU’RE HERE: The Next Palantir? One satellite company captures images of every point on Earth. Every single day. The Pentagon wants it. Hedge funds are using it to beat earnings. You’ve probably never heard of it.
This is what the early days of Palantir looked like before it became a giant. Same playbook. Different technology. If you missed Palantir, you need to see this. Claim The Stock Ticker for Free HERE.
Operating Margin
Operating margin is one of the best measures of profitability because it tells us how much money a company takes home after procuring and manufacturing its products, marketing and selling those products, and most importantly, keeping them relevant through research and development.
ESAB’s operating margin has more or less stayed the same over the last 12 months , averaging 13.9% over the last five years. This profitability was top-notch for an industrials business, showing it’s a well-run company with an efficient cost structure. This result isn’t surprising as its high gross margin gives it a favorable starting point.
Looking at the trend in its profitability, ESAB’s operating margin might have fluctuated slightly but has generally stayed the same over the last five years. This raises questions about the company’s expense base because its revenue growth should have given it leverage on its fixed costs, resulting in better economies of scale and profitability.
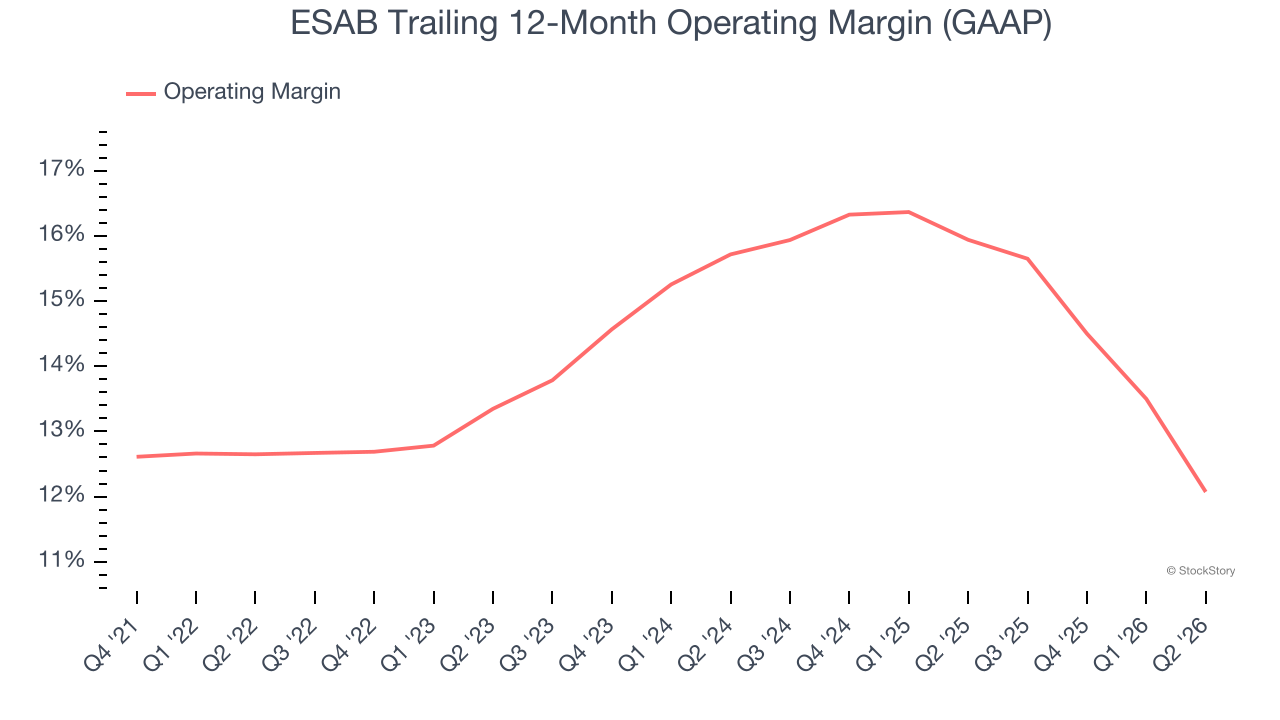
This quarter, ESAB generated an operating margin profit margin of 9.7%, down 5.5 percentage points year on year. Since ESAB’s operating margin decreased more than its gross margin, we can assume it was less efficient because expenses such as marketing, R&D, and administrative overhead increased.
Earnings Per Share
We track the long-term change in earnings per share (EPS) for the same reason as long-term revenue growth. Compared to revenue, however, EPS highlights whether a company’s growth is profitable.
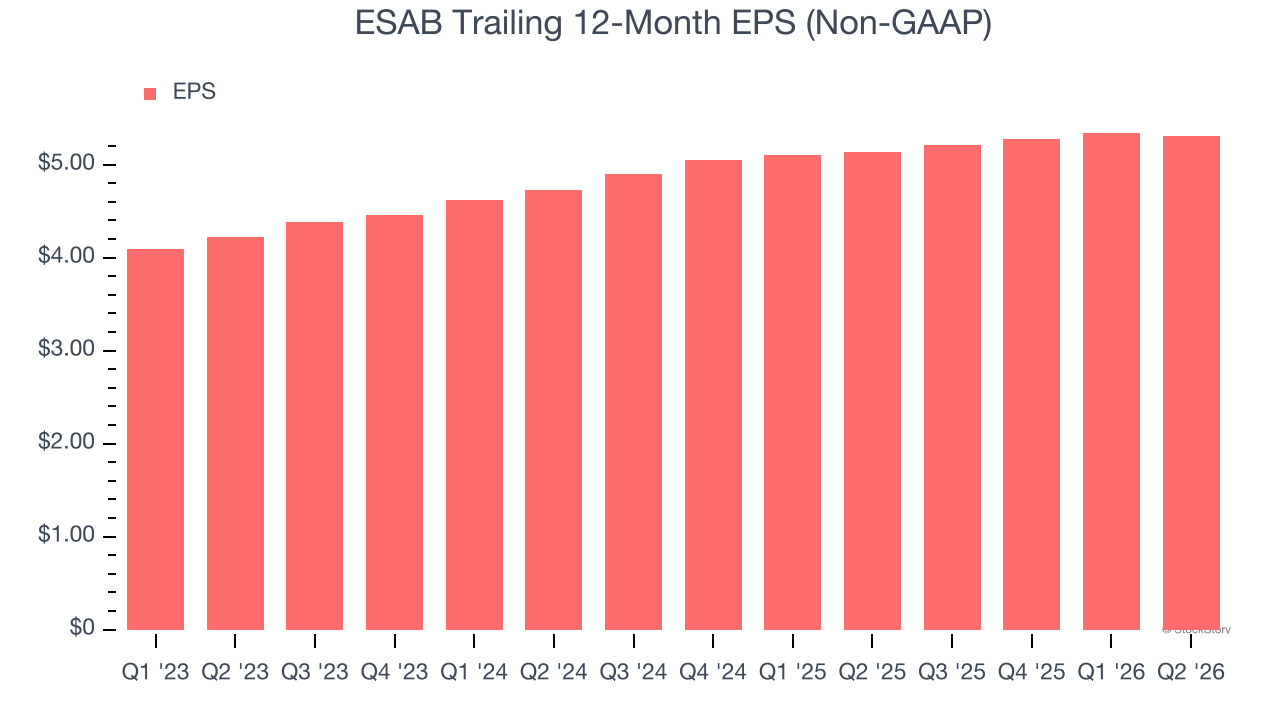
ESAB’s full-year EPS grew at a solid 10.7% compounded annual growth rate over the last three years, better than the broader industrials sector.
Like with revenue, we analyze EPS over a more recent period because it can provide insight into an emerging theme or development for the business.
For ESAB, its two-year annual EPS growth of 6% was lower than its three-year trend. We hope its growth can accelerate in the future.
In Q2, ESAB reported adjusted EPS of $1.33, down from $1.36 in the same quarter last year. This print missed analysts’ estimates, but we care more about long-term adjusted EPS growth than short-term movements. Over the next 12 months, Wall Street expects ESAB’s full-year EPS to grow 14.6% from $5.31 to $6.08.
Key Takeaways from ESAB’s Q2 Results
We enjoyed seeing ESAB beat analysts’ organic revenue expectations this quarter. We were also glad its revenue outperformed Wall Street’s estimates. On the other hand, its EPS missed and its full-year EBITDA guidance was in line with Wall Street’s estimates. Overall, this print was mixed but still had some key positives. The stock traded up 3.8% to $95.86 immediately after reporting.
Is ESAB an attractive investment opportunity right now? What happened in the latest quarter matters, but not as much as longer-term business quality and valuation, when deciding whether to invest in this stock. We cover that in our actionable full research report which you can read here (it’s free).