The iShares U.S. Home Construction ETF (ITB) is currently trapped in a stock-price rut. The fundamental math suggests the sector should be soaring: The United States faces a structural shortage of roughly 3 million to 4 million homes, and mortgage rates have finally dipped below the psychologically significant 6% threshold. Yet, the exchange-traded fund (ETF) is exhibiting a directionless, heavy behavior that has left many traders scratching their heads.
What’s Holding ITB Back?
The primary reason the lower-rates narrative isn't translating into a vertical move for the ETF lies in the internal economics of the builders. For the past two years, homebuilders have been acting as their own central banks. To keep sales moving when mortgage rates were at 7% or 8%, they heavily utilized mortgage rate buydowns — effectively paying thousands of dollars per house to artificially lower the buyer's interest rate.
Now that market rates are dipping naturally, builders are not necessarily seeing new demand. Instead, they are simply seeing their cost of incentives decrease. However, the market has already priced in this recovery. Investors are realizing that even with lower rates, builders are still having to offer aggressive incentives to lure buyers who are exhausted by record-high home prices.
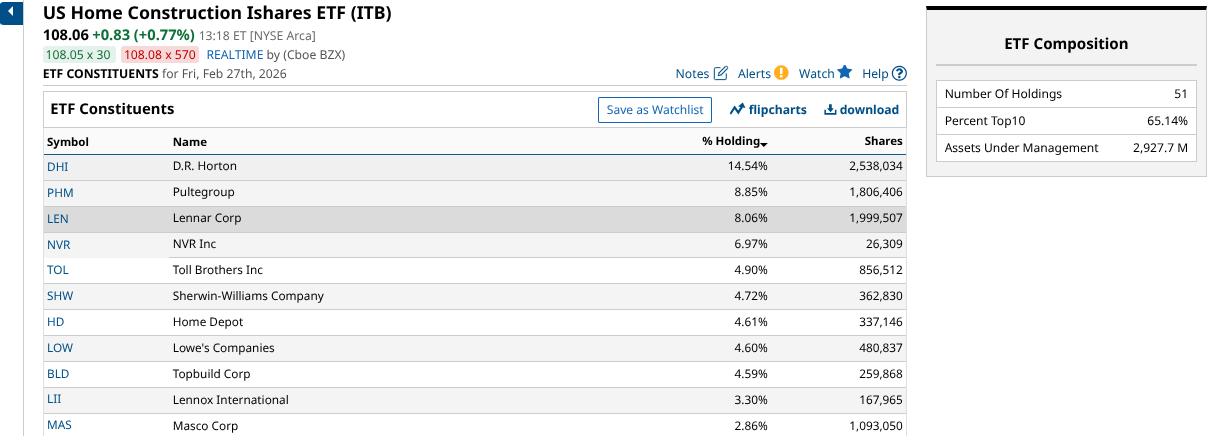
The ETF is top-heavy, like so many that target niche sectors like this one. Fifty stocks fill ITB, but 10 of them account for 65% of assets.
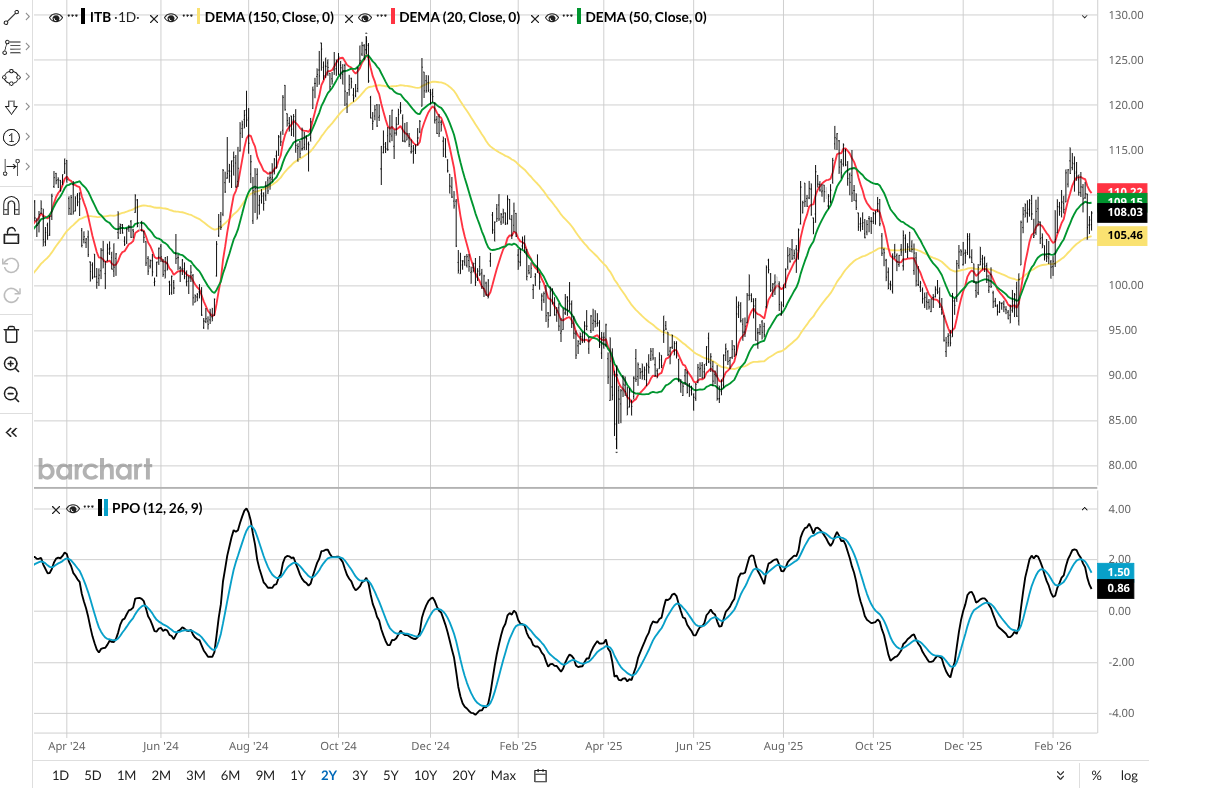
Here’s that volatile but trading-range-bound chart. It appeared to be on the verge of a breakout, but the 20-day moving average has something to say about that. It is a higher risk sign.
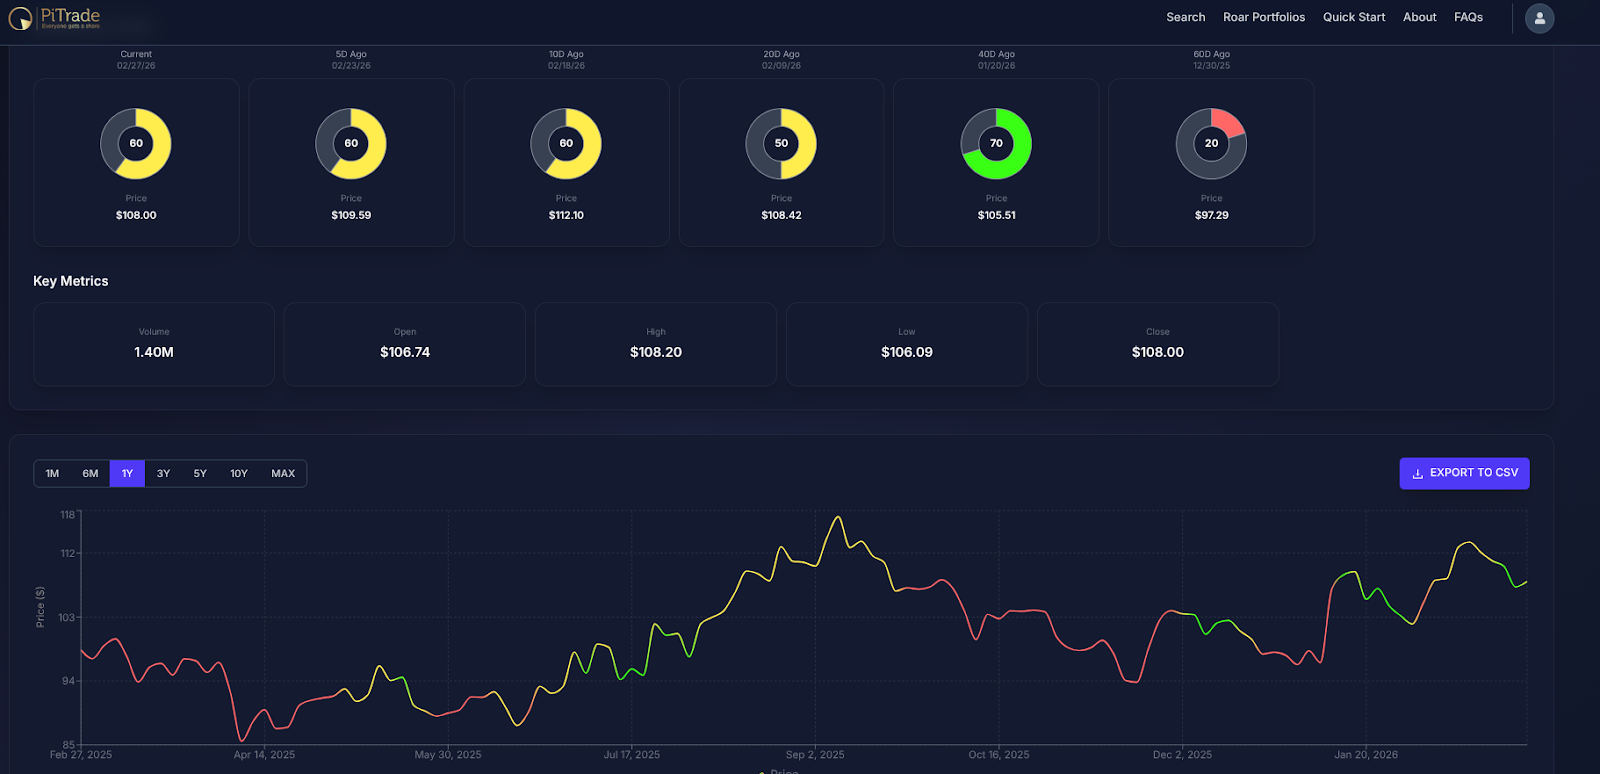
The ROAR analysis of ITB yields a similar result. Lots of head fakes, and the darting between yellow and green recently tells the same story as noted in the paragraph above. Pecking away, then ultimately failing to go significantly higher. Translation: trading range, at best.
The Buyer Traffic Stagnation
While house prices are high and supply is low, the actual traffic of prospective buyers remains near historic lows. The National Association of Home Builders (NAHB) sentiment index for February 2026 fell unexpectedly to 36, well below the breakeven point of 50, marking the fourth-straight month of decline. And instead of the usual spring thaw, builders are reporting that potential homeowners are staying on the sidelines, waiting for even lower rates or for prices to finally moderate.
Despite the dip in rates, the median listing price remains at levels that keep the monthly payment for a typical home near 30% of the median household income, a threshold that historically caps housing booms.
The Inventory Rebound vs. New Starts
Another factor keeping the ETF grounded is the sudden increase in existing home inventory. For several years, builders had a monopoly on supply because existing homeowners were locked in to their 3% mortgages and refused to sell. In 2026, that "lock-in effect" is finally beginning to crack.
Existing home inventory is projected to rise nearly 9% this year as life events — jobs, family changes, and divorces — force more people to list their properties.
Because of this return of competition and high construction costs, single-family housing starts are projected to remain essentially flat in 2026. Investors are seeing a sector that is stabilizing rather than one that is about to enter a new phase of hyper-growth.
Rob Isbitts created the ROAR Score, based on his 40+ years of technical analysis experience. ROAR helps DIY investors manage risk and create their own portfolios. For Rob's written research, check out ETFYourself.com.
On the date of publication, Rob Isbitts did not have (either directly or indirectly) positions in any of the securities mentioned in this article. All information and data in this article is solely for informational purposes. For more information please view the Barchart Disclosure Policy here.
More news from Barchart