RadNet currently trades at $74.71 and has been a dream stock for shareholders. It’s returned 305% since December 2020, blowing past the S&P 500’s 85.2% gain. The company has also beaten the index over the past six months as its stock price is up 36.2% thanks to its solid quarterly results.
Is now the time to buy RadNet, or should you be careful about including it in your portfolio? See what our analysts have to say in our full research report, it’s free for active Edge members.
Why Is RadNet Not Exciting?
We’re happy investors have made money, but we don't have much confidence in RadNet. Here are three reasons you should be careful with RDNT and a stock we'd rather own.
1. Fewer Distribution Channels Limit its Ceiling
Larger companies benefit from economies of scale, where fixed costs like infrastructure, technology, and administration are spread over a higher volume of goods or services, reducing the cost per unit. Scale can also lead to bargaining power with suppliers, greater brand recognition, and more investment firepower. A virtuous cycle can ensue if a scaled company plays its cards right.
With just $1.97 billion in revenue over the past 12 months, RadNet is a small company in an industry where scale matters. This makes it difficult to build trust with customers because healthcare is heavily regulated, complex, and resource-intensive.
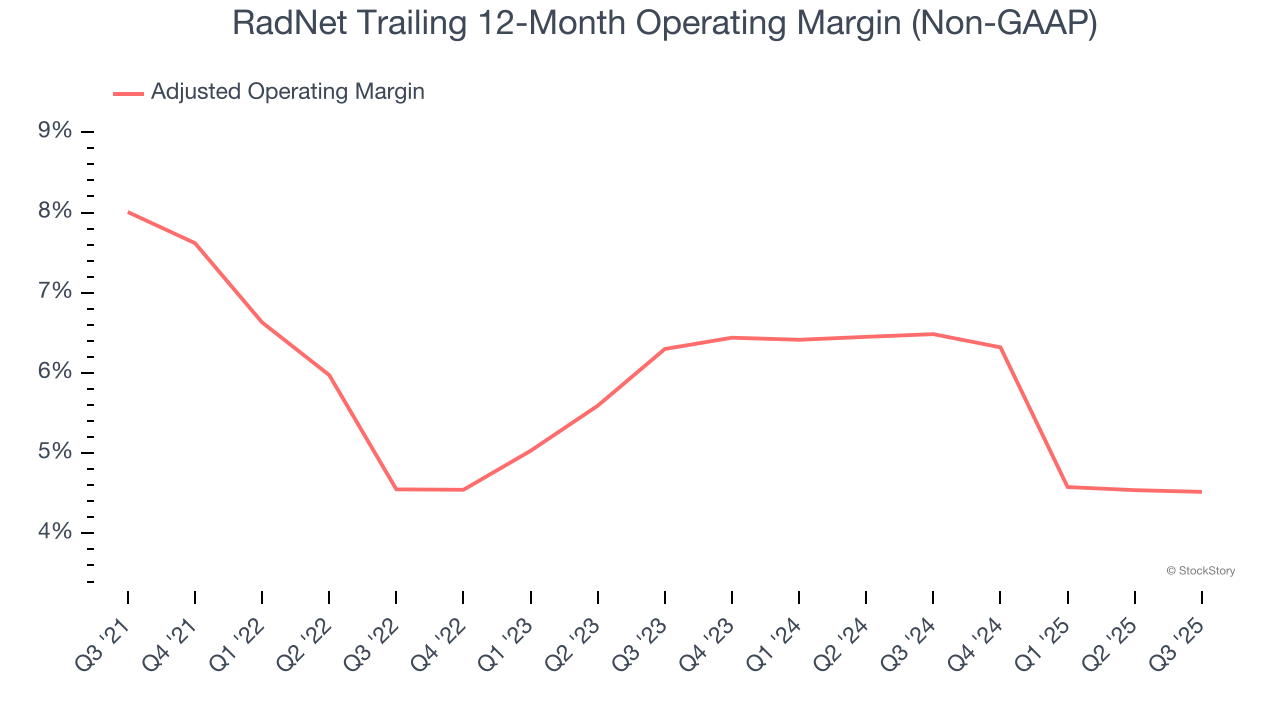
2. Shrinking Adjusted Operating Margin
Adjusted operating margin is a key measure of profitability. Think of it as net income (the bottom line) excluding the impact of non-recurring expenses, taxes, and interest on debt - metrics less connected to business fundamentals.
Analyzing the trend in its profitability, RadNet’s adjusted operating margin decreased by 3.5 percentage points over the last five years. This raises questions about the company’s expense base because its revenue growth should have given it leverage on its fixed costs, resulting in better economies of scale and profitability. RadNet’s performance was poor no matter how you look at it - it shows that costs were rising and it couldn’t pass them onto its customers. Its adjusted operating margin for the trailing 12 months was 4.5%.
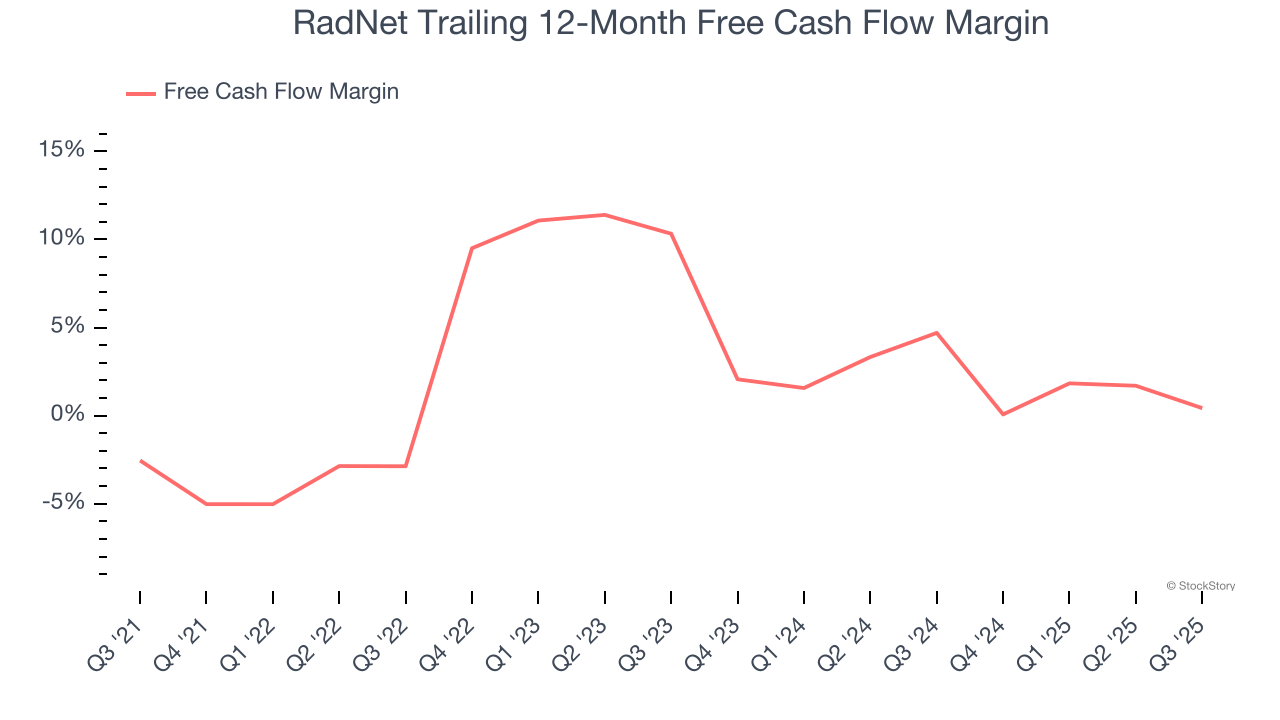
3. Mediocre Free Cash Flow Margin Limits Reinvestment Potential
If you’ve followed StockStory for a while, you know we emphasize free cash flow. Why, you ask? We believe that in the end, cash is king, and you can’t use accounting profits to pay the bills.
RadNet has shown mediocre cash profitability over the last five years, giving the company limited opportunities to return capital to shareholders. Its free cash flow margin averaged 2.3%, subpar for a healthcare business.
Final Judgment
RadNet’s business quality ultimately falls short of our standards. With its shares beating the market recently, the stock trades at 117.7× forward P/E (or $74.71 per share). This multiple tells us a lot of good news is priced in - we think there are better stocks to buy right now. We’d recommend looking at a fast-growing restaurant franchise with an A+ ranch dressing sauce.
Stocks We Would Buy Instead of RadNet
The market’s up big this year - but there’s a catch. Just 4 stocks account for half the S&P 500’s entire gain. That kind of concentration makes investors nervous, and for good reason. While everyone piles into the same crowded names, smart investors are hunting quality where no one’s looking - and paying a fraction of the price. Check out the high-quality names we’ve flagged in our Top 5 Strong Momentum Stocks for this week. This is a curated list of our High Quality stocks that have generated a market-beating return of 244% over the last five years (as of June 30, 2025).
Stocks that have made our list include now familiar names such as Nvidia (+1,326% between June 2020 and June 2025) as well as under-the-radar businesses like the once-micro-cap company Tecnoglass (+1,754% five-year return). Find your next big winner with StockStory today.