
Scientific instrument company Bruker (NASDAQ: BRKR). reported Q1 CY2025 results beating Wall Street’s revenue expectations, with sales up 11% year on year to $801.4 million. The company’s full-year revenue guidance of $3.52 billion at the midpoint came in 1% above analysts’ estimates. Its non-GAAP profit of $0.47 per share was 5.9% above analysts’ consensus estimates.
Is now the time to buy Bruker? Find out by accessing our full research report, it’s free.
Bruker (BRKR) Q1 CY2025 Highlights:
- Revenue: $801.4 million vs analyst estimates of $768.5 million (11% year-on-year growth, 4.3% beat)
- Adjusted EPS: $0.47 vs analyst estimates of $0.44 (5.9% beat)
- Adjusted EBITDA: $82.2 million vs analyst estimates of $123.5 million (10.3% margin, 33.4% miss)
- The company slightly lifted its revenue guidance for the full year to $3.52 billion at the midpoint from $3.51 billion
- Management lowered its full-year Adjusted EPS guidance to $2.44 at the midpoint, a 9.5% decrease
- Operating Margin: 4%, down from 9% in the same quarter last year
- Free Cash Flow Margin: 4.9%, up from 0.1% in the same quarter last year
- Organic Revenue rose 2.9% year on year (1.6% in the same quarter last year)
- Market Capitalization: $5.98 billion
Company Overview
With roots dating back to the pioneering days of nuclear magnetic resonance technology, Bruker (NASDAQ: BRKR) develops and manufactures high-performance scientific instruments that enable researchers and industrial analysts to explore materials at microscopic, molecular, and cellular levels.
Sales Growth
A company’s long-term sales performance can indicate its overall quality. Any business can put up a good quarter or two, but many enduring ones grow for years. Luckily, Bruker’s sales grew at a decent 11.1% compounded annual growth rate over the last five years. Its growth was slightly above the average healthcare company and shows its offerings resonate with customers.
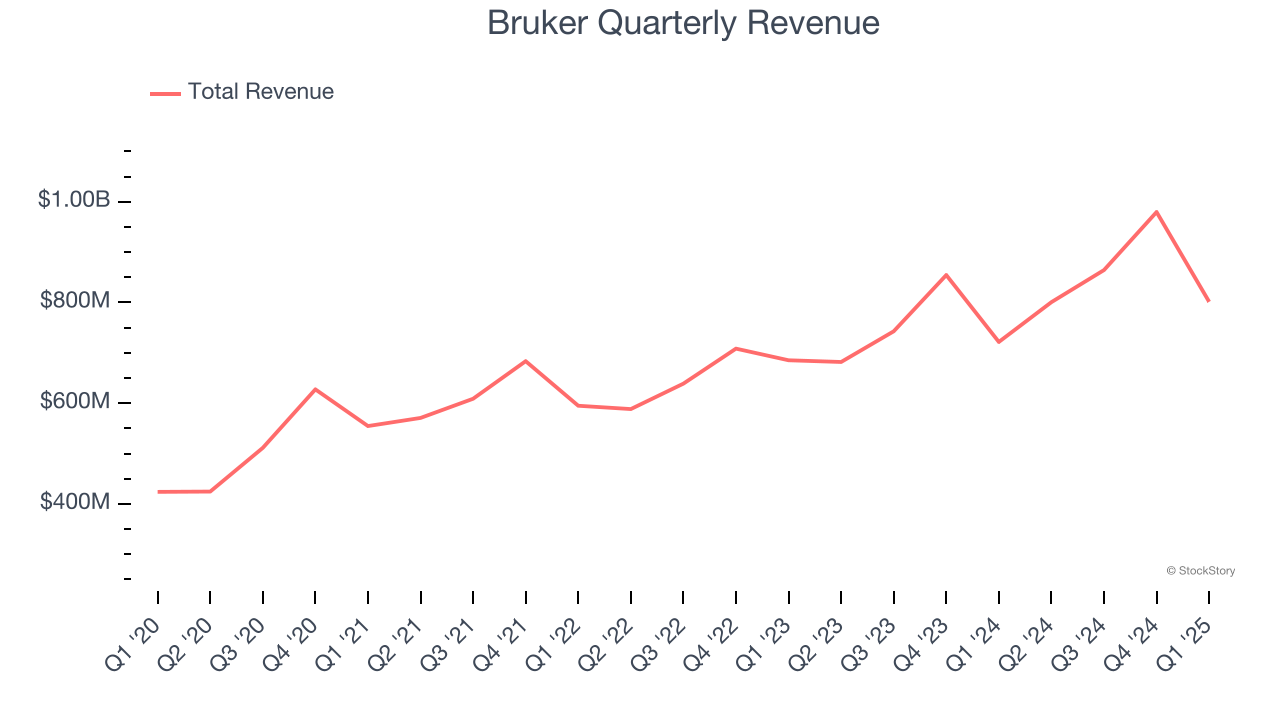
We at StockStory place the most emphasis on long-term growth, but within healthcare, a half-decade historical view may miss recent innovations or disruptive industry trends. Bruker’s annualized revenue growth of 14.7% over the last two years is above its five-year trend, suggesting its demand recently accelerated. 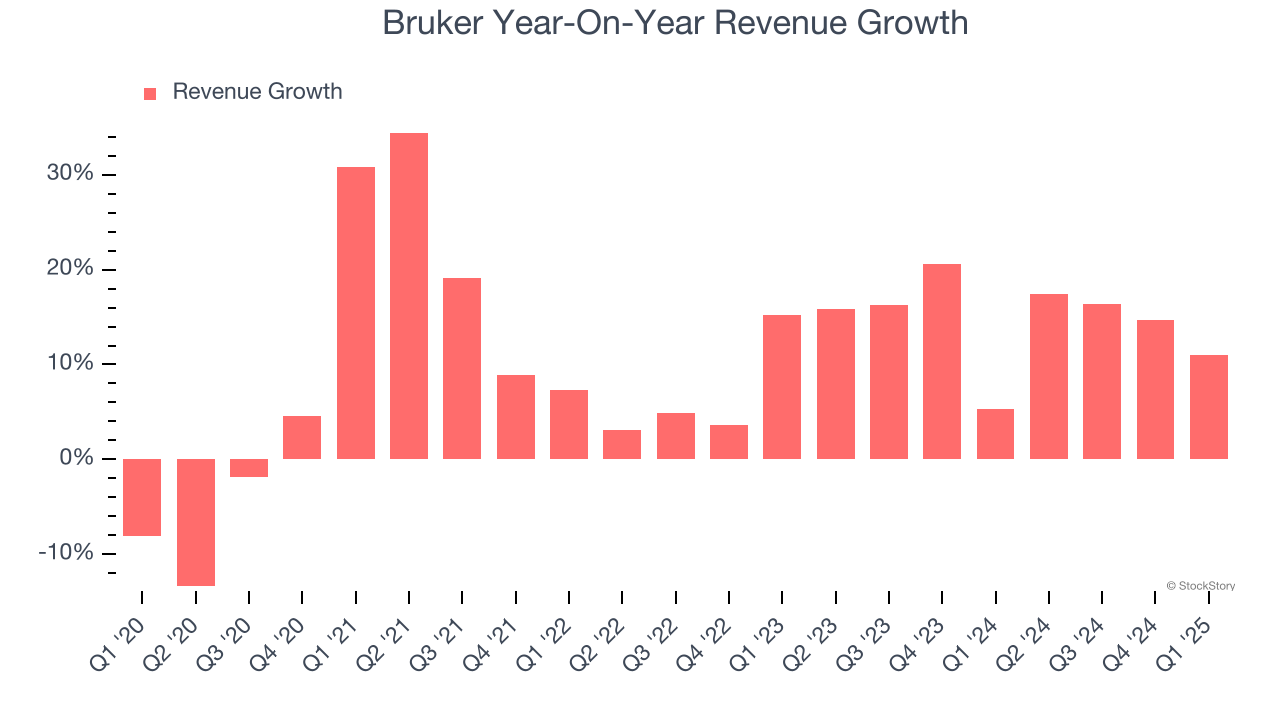
Bruker also reports organic revenue, which strips out one-time events like acquisitions and currency fluctuations that don’t accurately reflect its fundamentals. Over the last two years, Bruker’s organic revenue averaged 7.4% year-on-year growth. Because this number is lower than its normal revenue growth, we can see that some mixture of acquisitions and foreign exchange rates boosted its headline results. 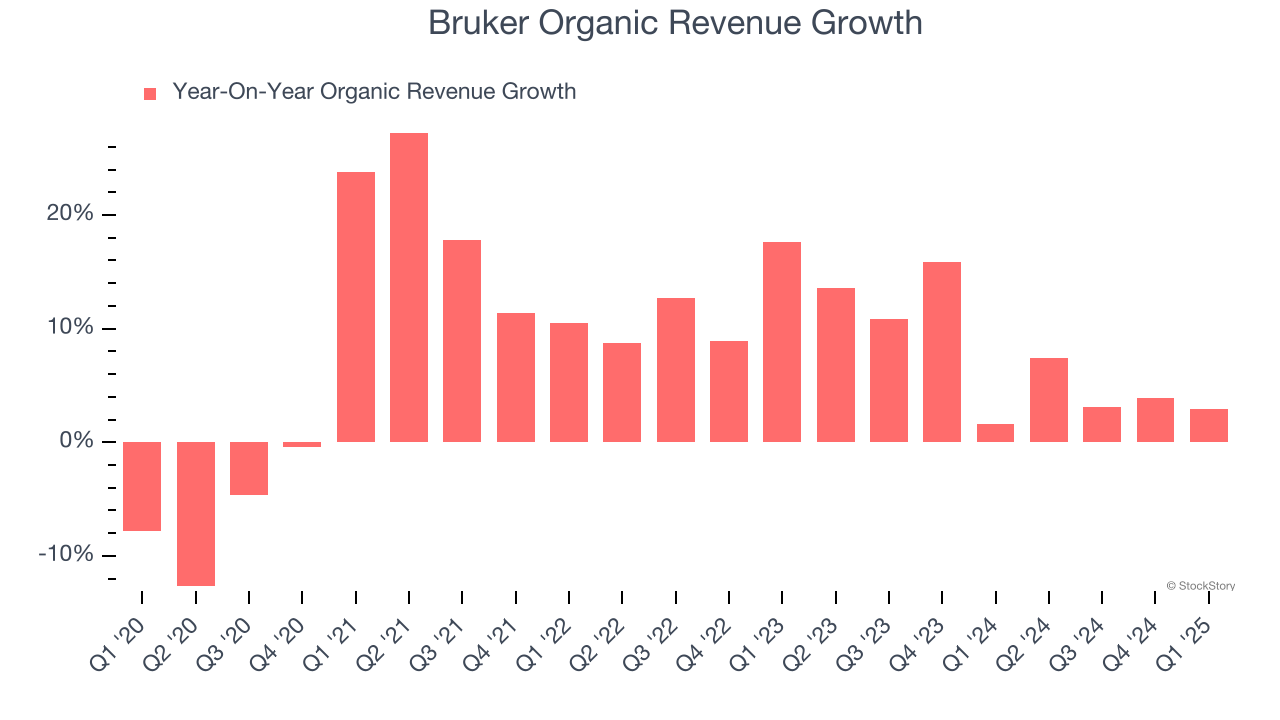
This quarter, Bruker reported year-on-year revenue growth of 11%, and its $801.4 million of revenue exceeded Wall Street’s estimates by 4.3%.
Looking ahead, sell-side analysts expect revenue to grow 2.1% over the next 12 months, a deceleration versus the last two years. This projection doesn't excite us and indicates its products and services will see some demand headwinds.
Here at StockStory, we certainly understand the potential of thematic investing. Diverse winners from Microsoft (MSFT) to Alphabet (GOOG), Coca-Cola (KO) to Monster Beverage (MNST) could all have been identified as promising growth stories with a megatrend driving the growth. So, in that spirit, we’ve identified a relatively under-the-radar profitable growth stock benefiting from the rise of AI, available to you FREE via this link.
Operating Margin
Operating margin is a key measure of profitability. Think of it as net income - the bottom line - excluding the impact of taxes and interest on debt, which are less connected to business fundamentals.
Bruker has done a decent job managing its cost base over the last five years. The company has produced an average operating margin of 13.2%, higher than the broader healthcare sector.
Analyzing the trend in its profitability, Bruker’s operating margin decreased by 8.8 percentage points over the last five years. This performance was caused by more recent speed bumps as the company’s margin fell by 11.1 percentage points on a two-year basis. We’re disappointed in these results because it shows its expenses were rising and it couldn’t pass those costs onto its customers.
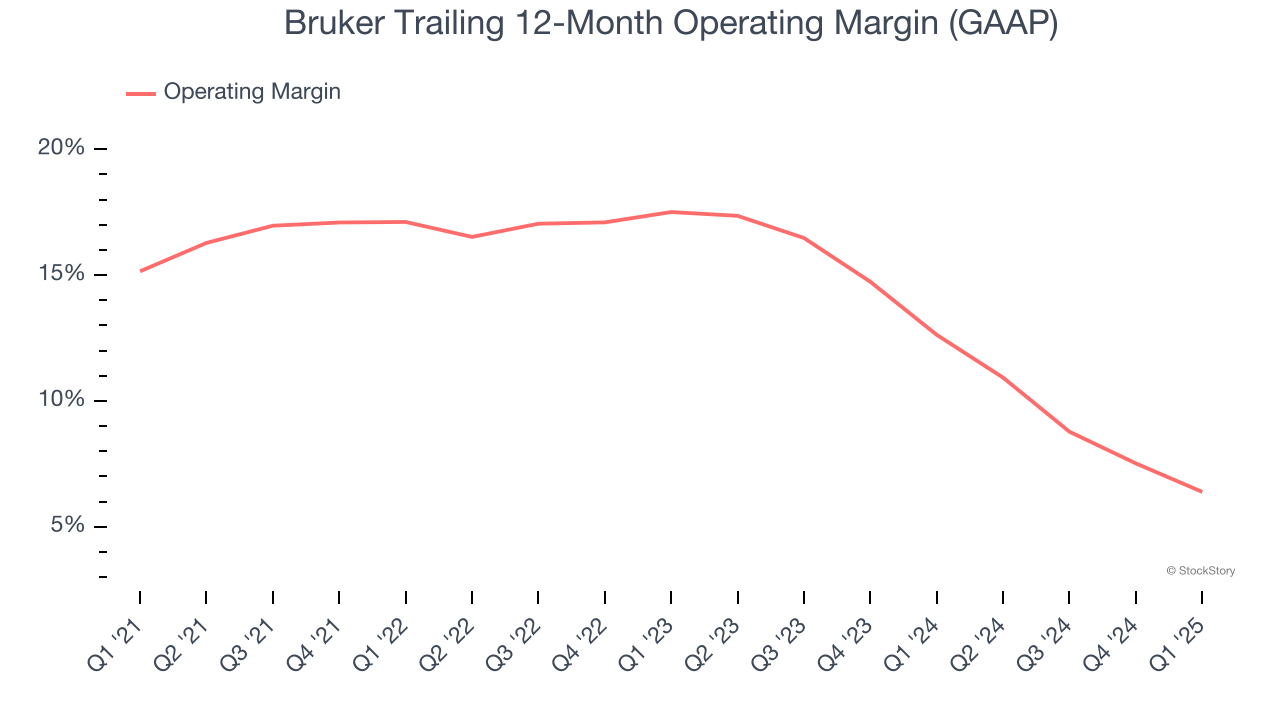
This quarter, Bruker generated an operating profit margin of 4%, down 5 percentage points year on year. This contraction shows it was less efficient because its expenses grew faster than its revenue.
Earnings Per Share
Revenue trends explain a company’s historical growth, but the long-term change in earnings per share (EPS) points to the profitability of that growth – for example, a company could inflate its sales through excessive spending on advertising and promotions.
Bruker’s remarkable 10.4% annual EPS growth over the last five years aligns with its revenue performance. This tells us it maintained its per-share profitability as it expanded.
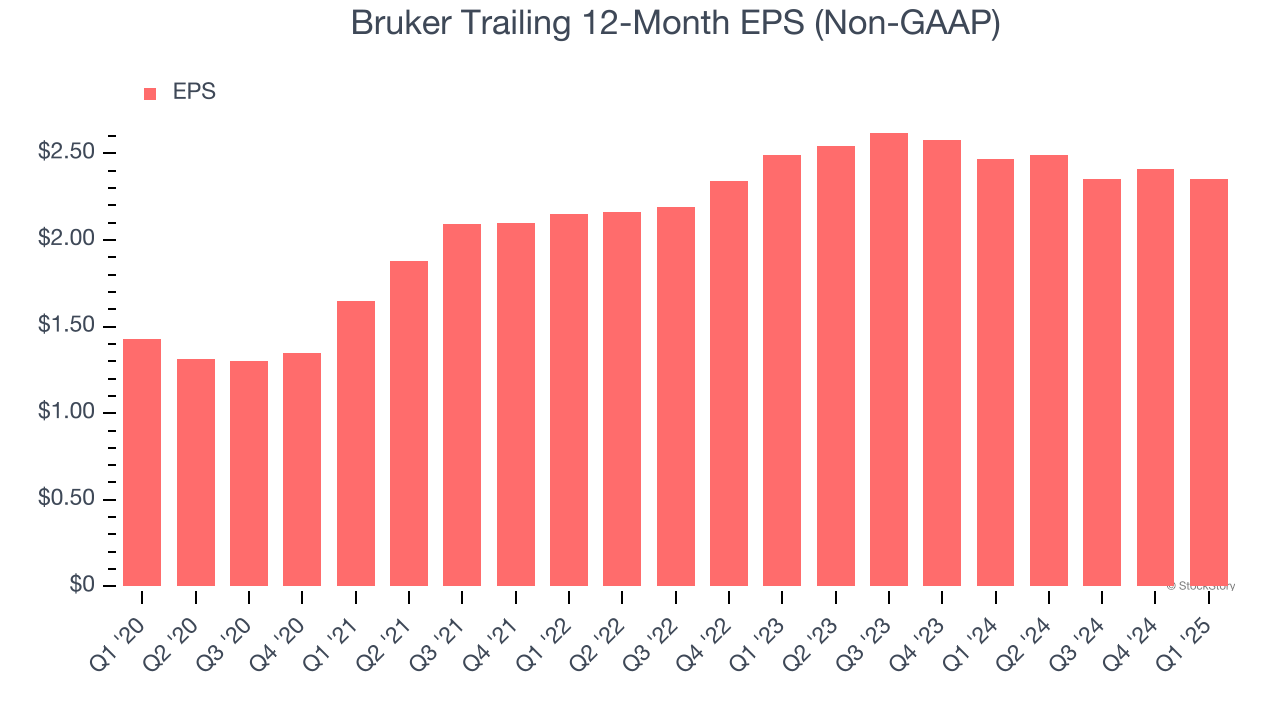
In Q1, Bruker reported EPS at $0.47, down from $0.53 in the same quarter last year. Despite falling year on year, this print beat analysts’ estimates by 5.9%. Over the next 12 months, Wall Street expects Bruker’s full-year EPS of $2.35 to grow 18.6%.
Key Takeaways from Bruker’s Q1 Results
We enjoyed seeing Bruker beat analysts’ organic revenue, EPS, and EBITDA expectations this quarter. We were also glad it slightly lifted its full-year revenue guidance. On the other hand, its full-year EPS guidance missed significantly. Overall, this print had some key positives, but the market seemed to be hoping for more. The stock traded down 2.6% to $38.40 immediately following the results.
Is Bruker an attractive investment opportunity at the current price? We think that the latest quarter is only one piece of the longer-term business quality puzzle. Quality, when combined with valuation, can help determine if the stock is a buy. We cover that in our actionable full research report which you can read here, it’s free.


