Homebuilder KB Home (NYSE: KBH) missed Wall Street’s revenue expectations in Q1 CY2026, with sales falling 22.6% year on year to $1.08 billion. Its GAAP profit of $0.52 per share was 4.5% below analysts’ consensus estimates.
Is now the time to buy KB Home? Find out by accessing our full research report, it’s free.
KB Home (KBH) Q1 CY2026 Highlights:
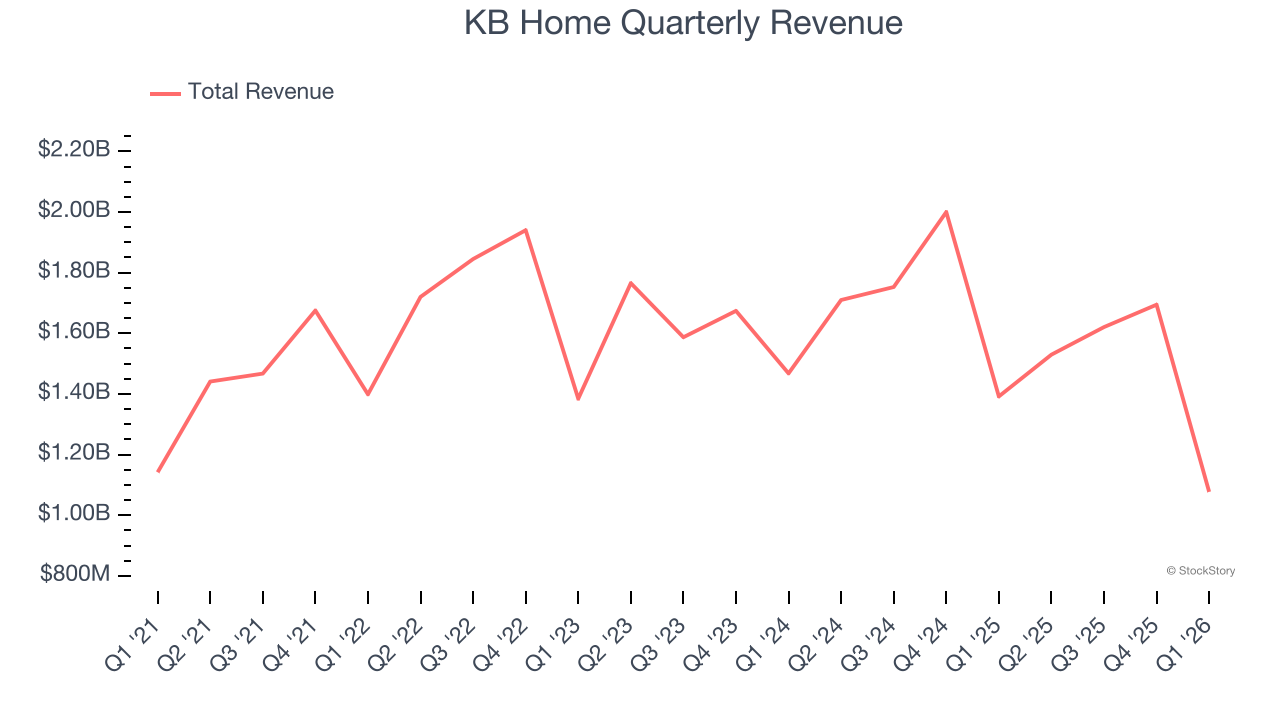
- Revenue: $1.08 billion vs analyst estimates of $1.10 billion (22.6% year-on-year decline, 1.8% miss)
- EPS (GAAP): $0.52 vs analyst expectations of $0.54 (4.5% miss)
- Adjusted EBITDA: $44.15 million vs analyst estimates of $69.64 million (4.1% margin, 36.6% miss)
- Operating Margin: 3.1%, down from 9.4% in the same quarter last year
- Backlog: $1.70 billion at quarter end, down 23% year on year
- Market Capitalization: $3.32 billion
"Our teams continued to execute well, particularly in the critical areas of new community openings and build times. We expect to reach our peak community count for the year within the second quarter at the height of the Spring selling season, which enhances our ability to drive net orders," said Robert McGibney, President and Chief Executive Officer.
Company Overview
The first homebuilder to be listed on the NYSE, KB Home (NYSE: KBH) is a homebuilding company targeting the first-time home buyer and move-up buyer markets.
Revenue Growth
A company’s long-term performance is an indicator of its overall quality. Even a bad business can shine for one or two quarters, but a top-tier one grows for years. Unfortunately, KB Home’s 6.9% annualized revenue growth over the last five years was mediocre. This was below our standard for the industrials sector and is a poor baseline for our analysis.
Long-term growth is the most important, but within industrials, a half-decade historical view may miss new industry trends or demand cycles. KB Home’s performance shows it grew in the past but relinquished its gains over the last two years, as its revenue fell by 4.5% annually. 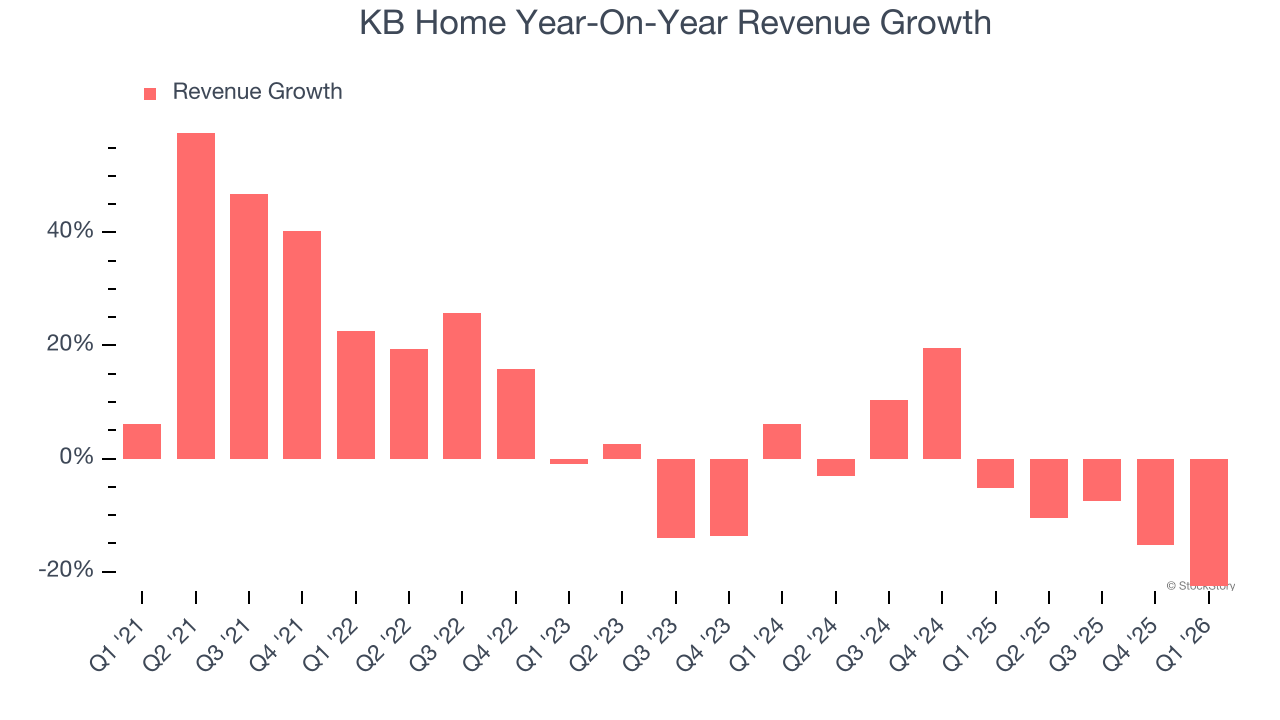
We can dig further into the company’s revenue dynamics by analyzing its backlog, or the value of its outstanding orders that have not yet been executed or delivered. KB Home’s backlog reached $1.70 billion in the latest quarter and averaged 28% year-on-year declines over the last two years. Because this number is lower than its revenue growth, we can see the company hasn’t secured enough new orders to maintain its growth rate in the future. 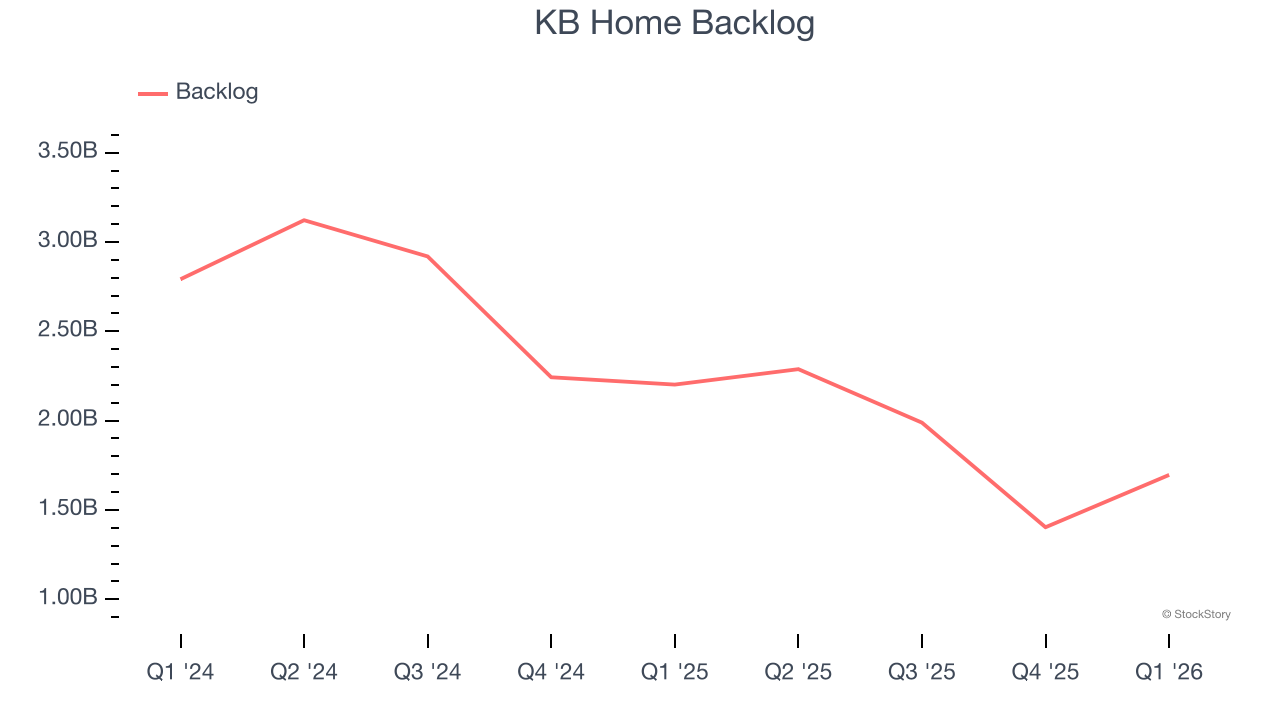
This quarter, KB Home missed Wall Street’s estimates and reported a rather uninspiring 22.6% year-on-year revenue decline, generating $1.08 billion of revenue.
Looking ahead, sell-side analysts expect revenue to decline by 6.8% over the next 12 months, a slight deceleration versus the last two years. This projection is underwhelming and suggests its products and services will see some demand headwinds.
WHILE YOU’RE HERE: The Next Palantir? One satellite company captures images of every point on Earth. Every single day. The Pentagon wants it. Hedge funds are using it to beat earnings. You’ve probably never heard of it.
This is what the early days of Palantir looked like before it became a $437 billion giant. Same playbook. Different technology. If you missed Palantir, you need to see this. Claim The Stock Ticker for Free HERE.
Operating Margin
KB Home has managed its cost base well over the last five years. It demonstrated solid profitability for an industrials business, producing an average operating margin of 11.5%. This result was particularly impressive because of its low gross margin, which is mostly a factor of what it sells and takes huge shifts to move meaningfully. Companies have more control over their operating margins, and it’s a show of well-managed operations if they’re high when gross margins are low.
Looking at the trend in its profitability, KB Home’s operating margin decreased by 5 percentage points over the last five years. This raises questions about the company’s expense base because its revenue growth should have given it leverage on its fixed costs, resulting in better economies of scale and profitability.
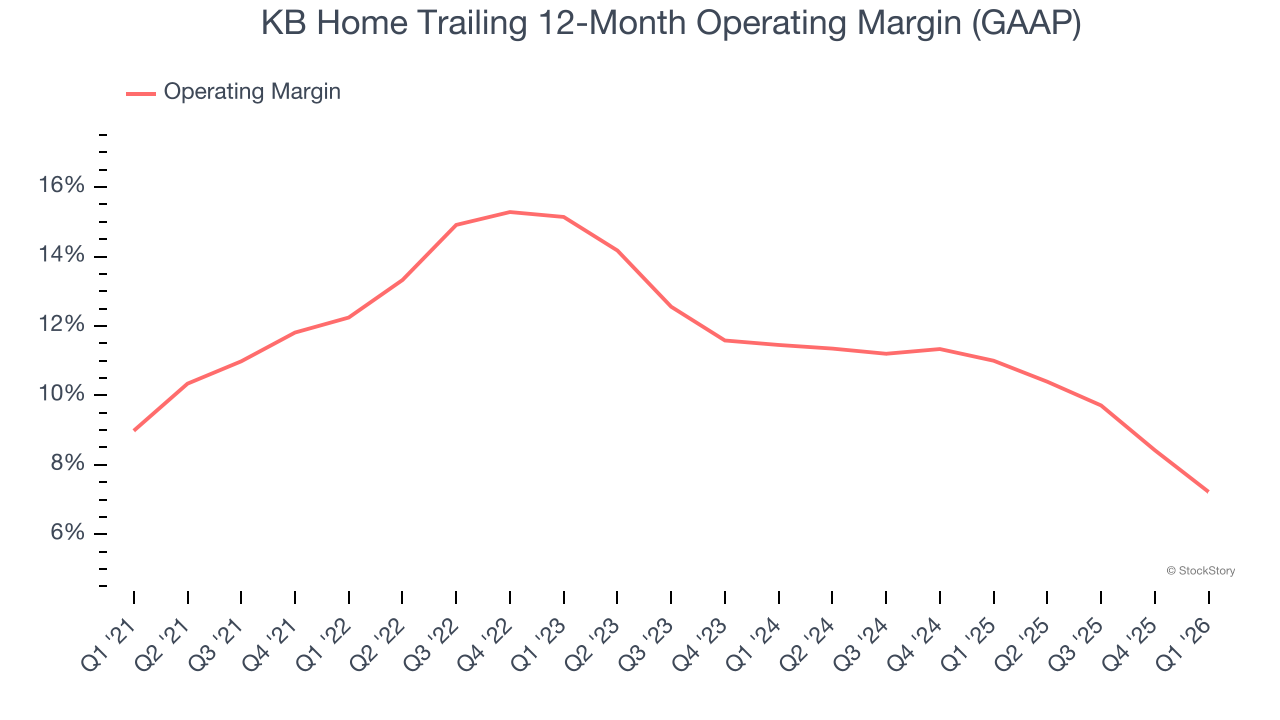
In Q1, KB Home generated an operating margin profit margin of 3.1%, down 6.3 percentage points year on year. Since KB Home’s operating margin decreased more than its gross margin, we can assume it was less efficient because expenses such as marketing, R&D, and administrative overhead increased.
Earnings Per Share
Revenue trends explain a company’s historical growth, but the long-term change in earnings per share (EPS) points to the profitability of that growth – for example, a company could inflate its sales through excessive spending on advertising and promotions.
KB Home’s decent 8.2% annual EPS growth over the last five years aligns with its revenue performance. This tells us it maintained its per-share profitability as it expanded.
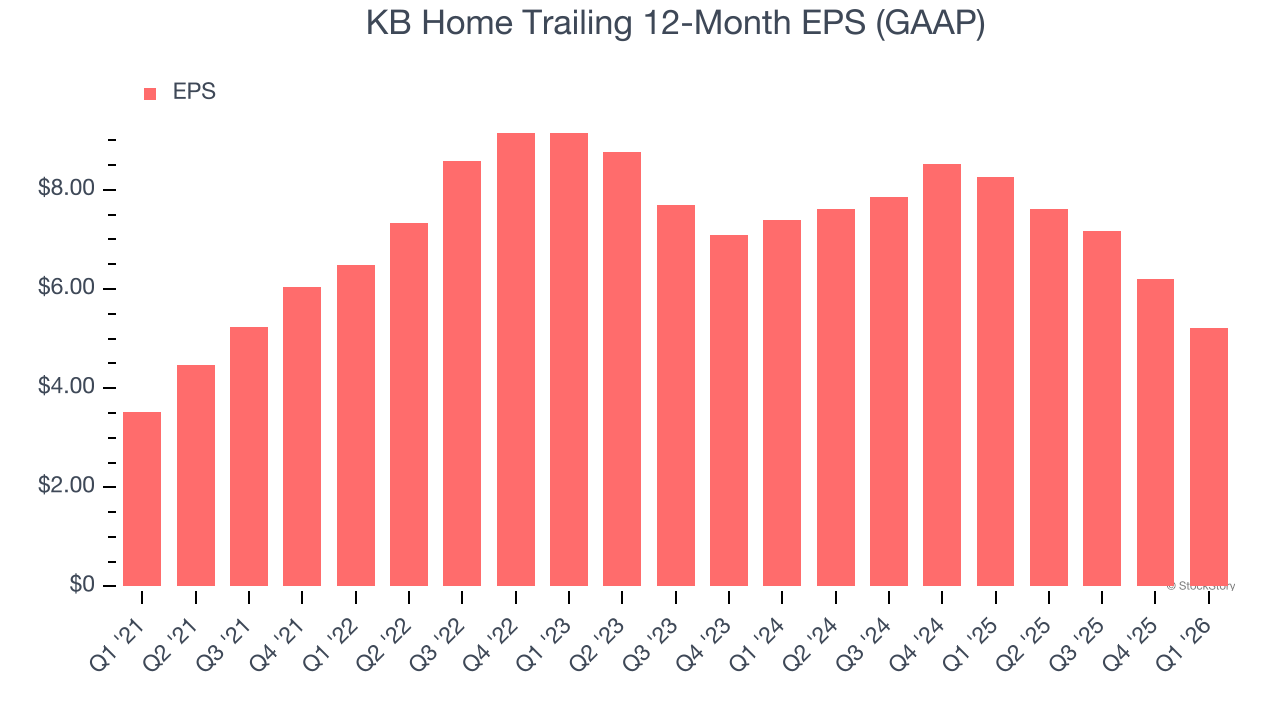
Like with revenue, we analyze EPS over a shorter period to see if we are missing a change in the business.
KB Home’s two-year annual EPS declines of 16% were bad and lower than its two-year revenue losses.
We can take a deeper look into KB Home’s earnings to better understand the drivers of its performance. KB Home’s operating margin has declined over the last two years. This was the most relevant factor (aside from the revenue impact) behind its lower earnings; interest expenses and taxes can also affect EPS but don’t tell us as much about a company’s fundamentals.
In Q1, KB Home reported EPS of $0.52, down from $1.50 in the same quarter last year. This print missed analysts’ estimates, but we care more about long-term EPS growth than short-term movements. Over the next 12 months, Wall Street expects KB Home’s full-year EPS of $5.22 to shrink by 15.8%.
Key Takeaways from KB Home’s Q1 Results
We struggled to find many positives in these results. Its EBITDA missed and its EPS fell short of Wall Street’s estimates. Overall, this quarter could have been better. The stock traded down 6.8% to $49.38 immediately after reporting.
KB Home may have had a tough quarter, but does that actually create an opportunity to invest right now? We think that the latest quarter is only one piece of the longer-term business quality puzzle. Quality, when combined with valuation, can help determine if the stock is a buy. We cover that in our actionable full research report which you can read here (it’s free).