IT solutions provider Connection (NASDAQ: CNXN) announced better-than-expected revenue in Q1 CY2026, with sales up 3% year on year to $721.9 million. Its non-GAAP profit of $0.77 per share was 24.2% above analysts’ consensus estimates.
Is now the time to buy Connection? Find out by accessing our full research report, it’s free.
Connection (CNXN) Q1 CY2026 Highlights:
- Revenue: $721.9 million vs analyst estimates of $696.1 million (3% year-on-year growth, 3.7% beat)
- Adjusted EPS: $0.77 vs analyst estimates of $0.62 (24.2% beat)
- Adjusted EBITDA: $28.72 million vs analyst estimates of $22.33 million (4% margin, 28.6% beat)
- Operating Margin: 2.8%, in line with the same quarter last year
- Free Cash Flow was $12.28 million, up from -$54.1 million in the same quarter last year
- Market Capitalization: $1.60 billion
Company Overview
Starting as a small computer products seller in 1982 and evolving into a Fortune 1000 company, Connection (NASDAQ: CNXN) is a technology solutions provider that helps businesses and government agencies design, purchase, implement, and manage their IT infrastructure and systems.
Revenue Growth
A company’s long-term performance is an indicator of its overall quality. Any business can have short-term success, but a top-tier one grows for years.
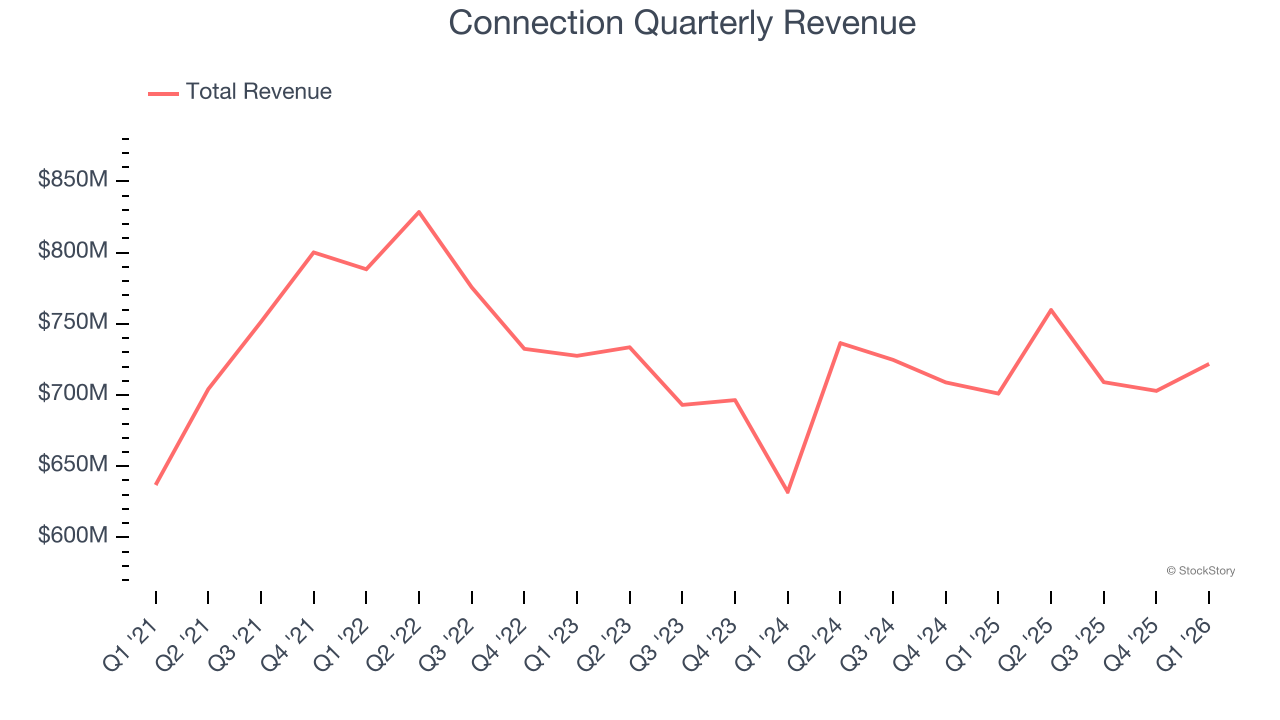
With $2.89 billion in revenue over the past 12 months, Connection is a mid-sized business services company, which sometimes brings disadvantages compared to larger competitors benefiting from better economies of scale.
As you can see below, Connection’s sales grew at a sluggish 2.8% compounded annual growth rate over the last five years. This shows it failed to generate demand in any major way and is a rough starting point for our analysis.
We at StockStory place the most emphasis on long-term growth, but within business services, a half-decade historical view may miss recent innovations or disruptive industry trends. Connection’s annualized revenue growth of 2.5% over the last two years aligns with its five-year trend, suggesting its demand was consistently weak. 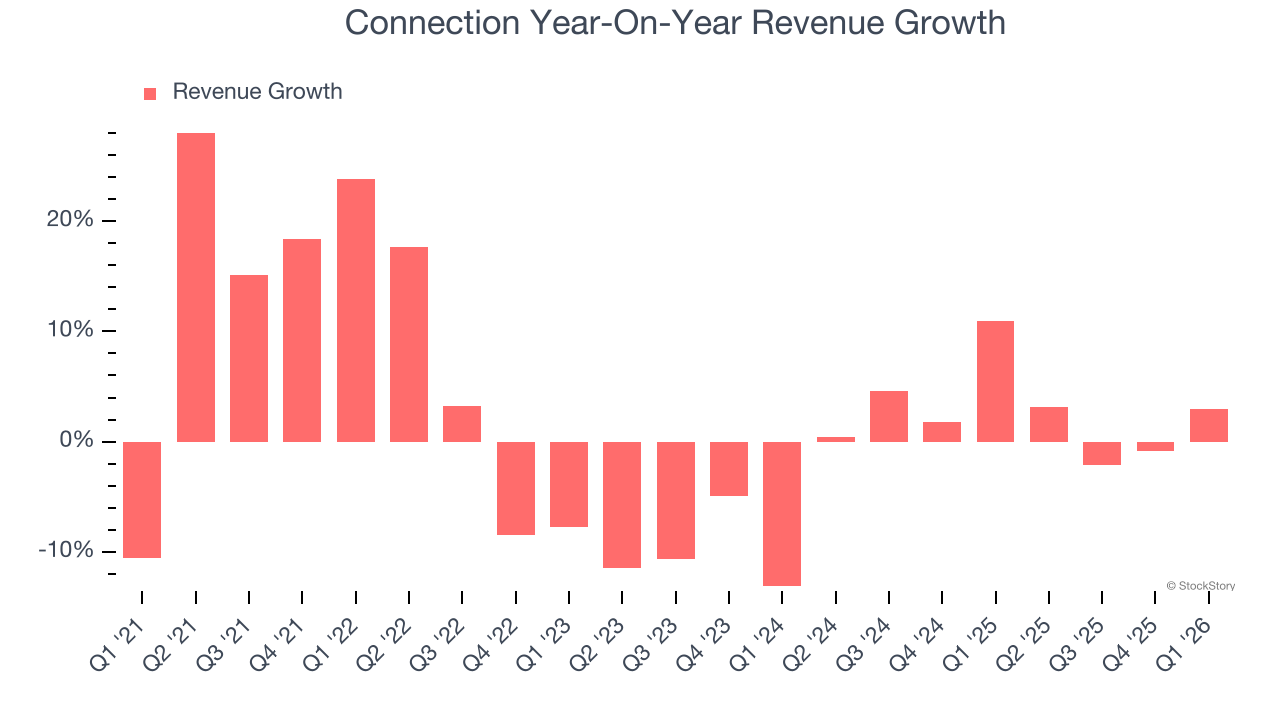
This quarter, Connection reported modest year-on-year revenue growth of 3% but beat Wall Street’s estimates by 3.7%.
Looking ahead, sell-side analysts expect revenue to grow 5.1% over the next 12 months, an improvement versus the last two years. This projection is above average for the sector and indicates its newer products and services will spur better top-line performance.
ONE MORE THING: 3 Hidden Platforms Growing 3X Faster than Amazon, Google, and PayPal. Amazon, Google, and Meta all followed the same playbook: Dominate an ignored market. Build an unbeatable moat. Scale until you’re unstoppable.
These three platforms are running that exact playbook right now. The early investors in Amazon made fortunes. The early investors in these could do the same. Get All 3 Stocks Here for FREE.
Adjusted Operating Margin
Adjusted operating margin is an important measure of profitability as it shows the portion of revenue left after accounting for all core expenses – everything from the cost of goods sold to advertising and wages. It’s also useful for comparing profitability across companies because it excludes non-recurring expenses, interest on debt, and taxes.
Connection’s adjusted operating margin has more or less stayed the same over the last 12 months , averaging 3.8% over the last five years. This profitability was lousy for a business services business and caused by its suboptimal cost structure.
Looking at the trend in its profitability, Connection’s adjusted operating margin might fluctuated slightly but has generally stayed the same over the last five years. This raises questions about the company’s expense base because its revenue growth should have given it leverage on its fixed costs, resulting in better economies of scale and profitability.
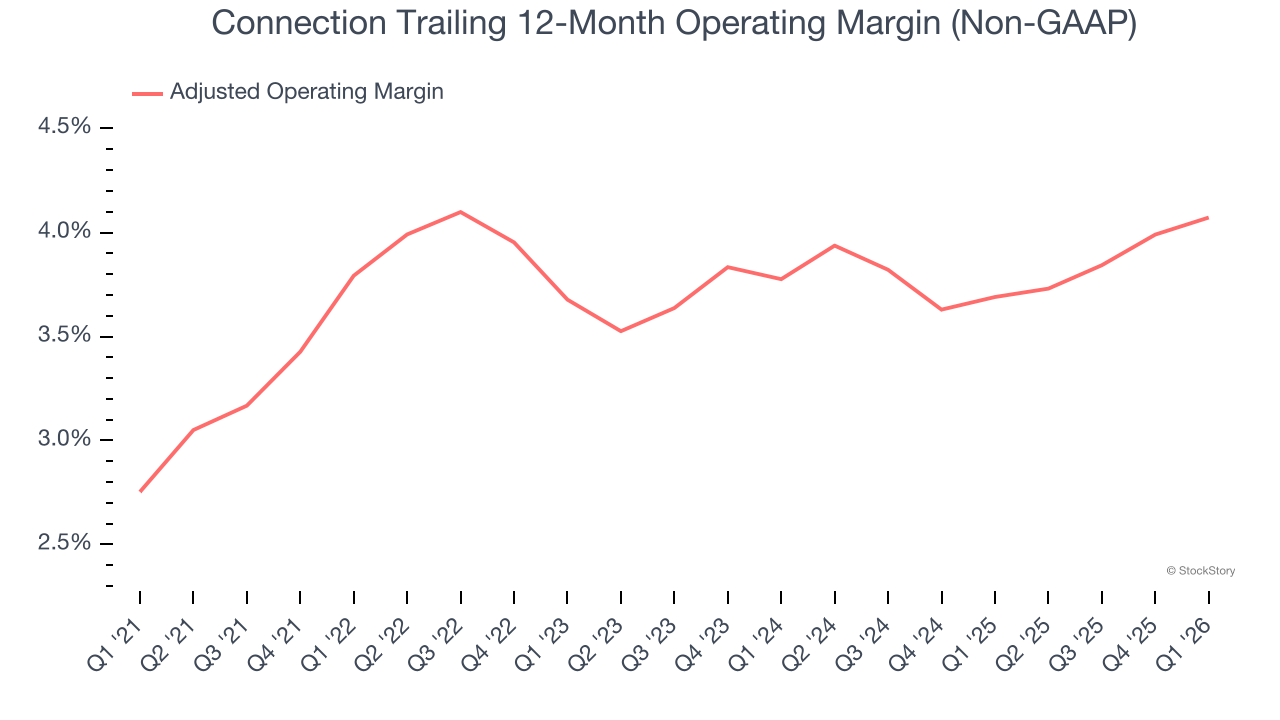
In Q1, Connection generated an adjusted operating margin profit margin of 3.2%, in line with the same quarter last year. This indicates the company’s overall cost structure has been relatively stable.
Earnings Per Share
We track the long-term change in earnings per share (EPS) for the same reason as long-term revenue growth. Compared to revenue, however, EPS highlights whether a company’s growth is profitable.
Connection’s EPS grew at 12.9% compounded annual growth rate over the last five years, higher than its 2.8% annualized revenue growth. However, this alone doesn’t tell us much about its business quality because its adjusted operating margin didn’t improve.
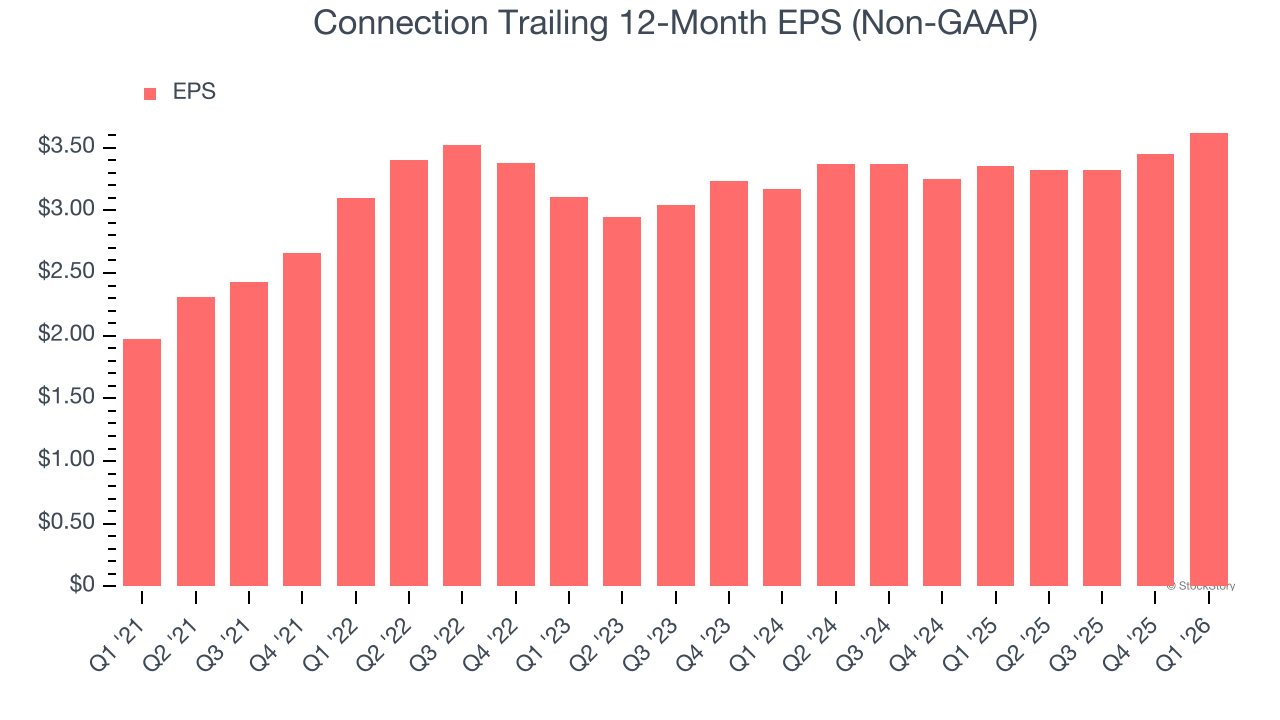
Like with revenue, we analyze EPS over a more recent period because it can provide insight into an emerging theme or development for the business.
For Connection, its two-year annual EPS growth of 6.9% was lower than its five-year trend. We hope its growth can accelerate in the future.
In Q1, Connection reported adjusted EPS of $0.77, up from $0.60 in the same quarter last year. This print easily cleared analysts’ estimates, and shareholders should be content with the results. Over the next 12 months, Wall Street expects Connection’s full-year EPS of $3.62 to grow 5.7%.
Key Takeaways from Connection’s Q1 Results
It was good to see Connection beat analysts’ EPS expectations this quarter. We were also glad its revenue outperformed Wall Street’s estimates. Zooming out, we think this was a solid print. The stock remained flat at $63.28 immediately after reporting.
Should you buy the stock or not? The latest quarter does matter, but not nearly as much as longer-term fundamentals and valuation, when deciding if the stock is a buy. We cover that in our actionable full research report which you can read here (it’s free).