Natural gas producer CNX Resources (NYSE: CNX) reported Q1 CY2026 results beating Wall Street’s revenue expectations, with sales up 53.4% year on year to $722 million. Its GAAP profit of $2.18 per share was significantly above analysts’ consensus estimates.
Is now the time to buy CNX Resources? Find out by accessing our full research report, it’s free.
CNX Resources (CNX) Q1 CY2026 Highlights:
- Revenue: $722 million vs analyst estimates of $545.8 million (53.4% year-on-year growth, 32.3% beat)
- EPS (GAAP): $2.18 vs analyst estimates of $0.97 (significant beat)
- Adjusted EBITDA: $609.3 million vs analyst estimates of $378.1 million (84.4% margin, 61.2% beat)
- Operating Margin: 65%, up from -50.3% in the same quarter last year
- Free Cash Flow Margin: 14.9%, down from 17.9% in the same quarter last year
- Market Capitalization: $5.58 billion
Company Overview
Tracing back to operations that began in 1860, CNX Resources (NYSE: CNX) drills for and produces natural gas from underground shale formations in Pennsylvania, Ohio, and West Virginia.
Revenue Growth
Cyclical industries such as Energy can make mediocre companies look great for a time, but a long-term view reveals which businesses can actually withstand and adapt to changing conditions. Unfortunately, CNX Resources’s 7.4% annualized revenue growth over the last five years was tepid. This was below our standard for the energy upstream and integrated energy sector and is a tough starting point for our analysis.
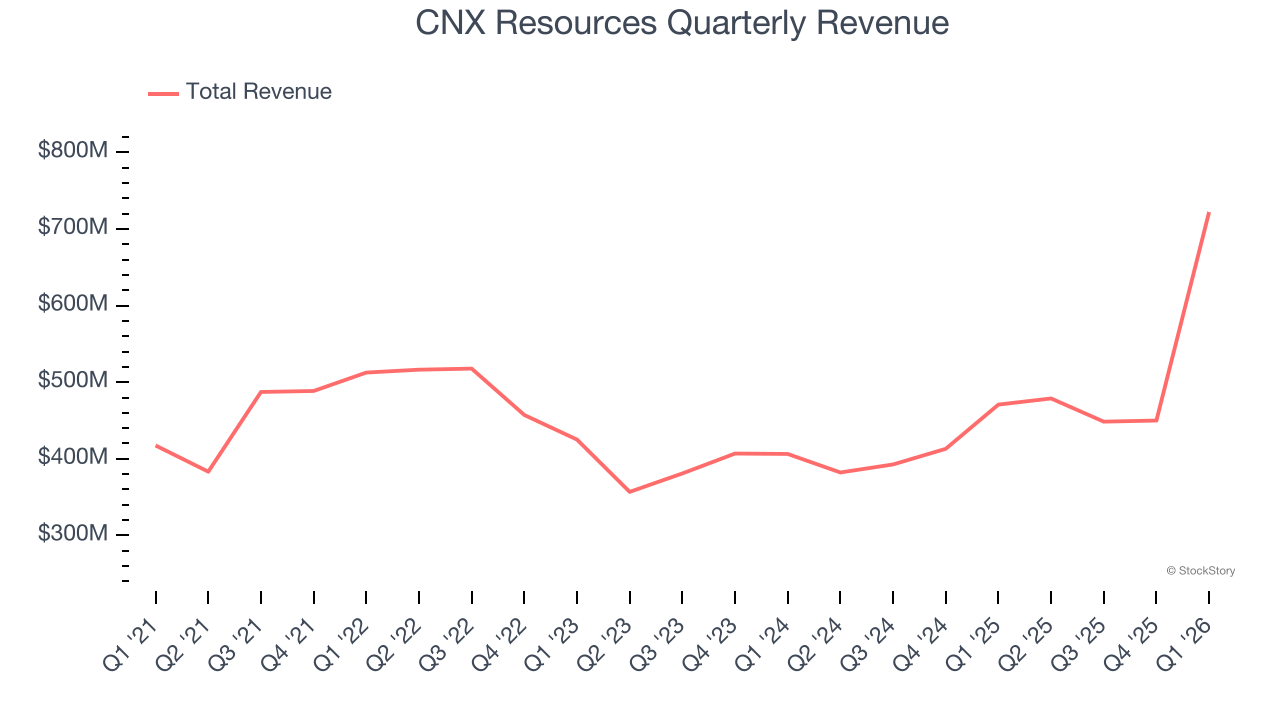
Even a long stretch in Energy can be shaped by a single commodity cycle, so extending the view to ten years adds another perspective and reveals which companies are built to grow regardless of the pricing regime. CNX Resources’s recent performance shows its demand has accelerated as its revenue was flat over the last ten years.
This quarter, CNX Resources reported magnificent year-on-year revenue growth of 53.4%, and its $722 million of revenue beat Wall Street’s estimates by 32.3%.
ONE MORE THING: 3 Hidden Platforms Growing 3X Faster than Amazon, Google, and PayPal. Amazon, Google, and Meta all followed the same playbook: Dominate an ignored market. Build an unbeatable moat. Scale until you’re unstoppable.
These three platforms are running that exact playbook right now. The early investors in Amazon made fortunes. The early investors in these could do the same. Get All 3 Stocks Here for FREE.
Adjusted EBITDA Margin
CNX Resources has been a well-oiled machine over the last five years. It demonstrated elite profitability for an upstream and integrated energy business, boasting an average EBITDA margin of 65.2%.
Analyzing the trend in its profitability, CNX Resources’s EBITDA margin rose by 6 percentage points over the last year, showing its efficiency has improved.
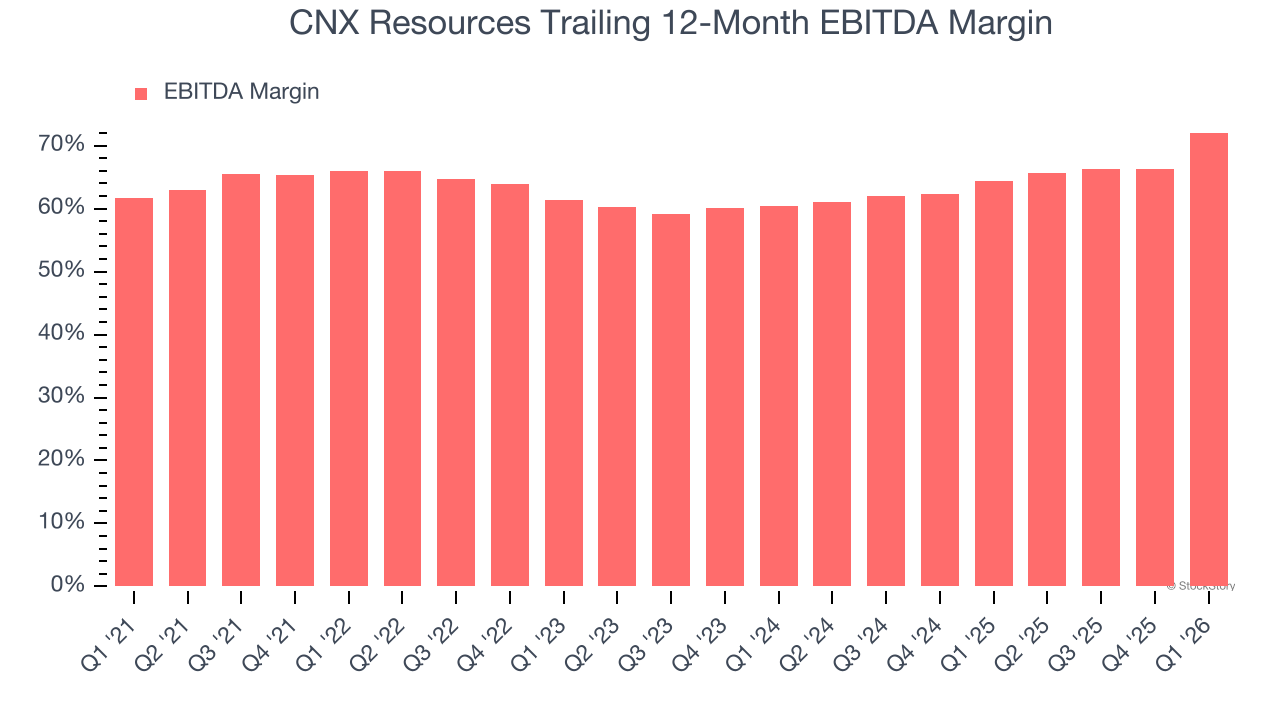
In Q1, CNX Resources generated an EBITDA margin profit margin of 84.4%, up 16.4 percentage points year on year. This increase was a welcome development and shows it was more efficient. This adjusted EBITDA beat Wall Street’s estimates by 61.2%.
Cash Is King
As mentioned above, adjusted EBITDA ignores capital structure and drilling expenditure decisions. These are two huge aspects of an Energy producer, so in order to understand a comprehensive picture of business quality, an investor needs to account for these. Said differently, adjusted EBITDA margins could be solid but free cash flow is abysmal because decline rates of the asset are extreme and the drilling is expensive. Free cash flow tells you about not only the economics of the production that has happened but how much it costs to stay in business as well (further drilling or extraction).
CNX Resources has shown terrific cash profitability, driven by its lucrative business model that enables it to reinvest, return capital to investors, and stay ahead of the competition. The company’s free cash flow margin was among the best in the energy upstream and integrated energy sector, averaging 22.9% over the last five years.
Absolute FCF margin levels matter but so does stability of free cash flow. All else equal, we’d prefer a 25.0% average free cash flow margin that is quite steady no matter how commodity prices behave rather than extremely high margins when times are good and negative ones when they’re tough.
CNX Resources’s ratio of quarterly free cash flow volatility to Henry Hub gas-price volatility over the past five years was 1.5 (lower is better), indicating excellent insulation from commodity swings. This stability supports superior capital access in downturns and positions CNX Resources to act as a consolidator when weaker peers are forced to retrench.
You may be asking why we wait until the free cash flow line to perform this stability analysis versus commodity prices. Why not compare revenue or EBITDA to Henry Hub in the case of CNX Resources? Because what ultimately matters is not how much revenue or profit you earn when prices are high but how much cash you can generate when prices are low. Free cash flow is the superior metric because it includes everything from hedging prowess to growth and maintenance capex to management behavior during good times and bad.
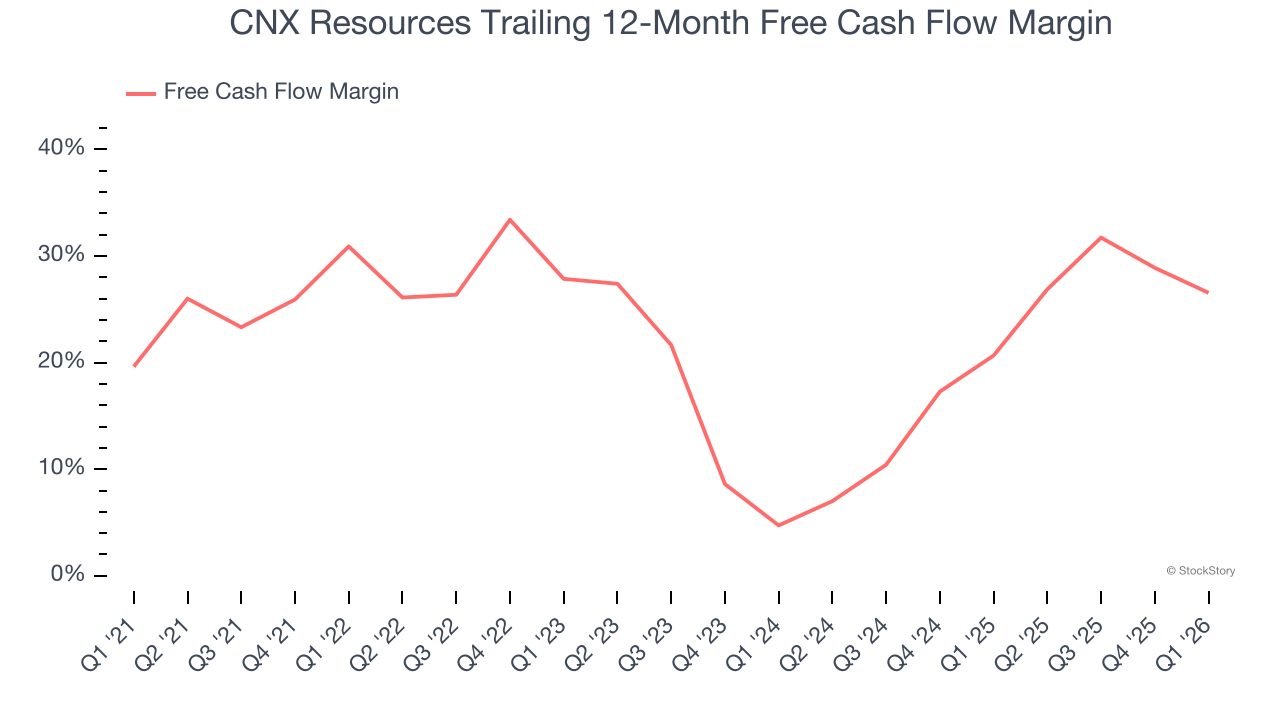
CNX Resources’s free cash flow clocked in at $107.6 million in Q1, equivalent to a 14.9% margin. The company’s cash profitability regressed as it was 3 percentage points lower than in the same quarter last year, which isn’t ideal considering its longer-term trend.
Key Takeaways from CNX Resources’s Q1 Results
It was good to see CNX Resources beat analysts’ revenue expectations this quarter. We were also excited its EPS outperformed Wall Street’s estimates by a wide margin. Zooming out, we think this was a solid print. The stock remained flat at $39.40 immediately after reporting.
Sure, CNX Resources had a solid quarter, but if we look at the bigger picture, is this stock a buy? What happened in the latest quarter matters, but not as much as longer-term business quality and valuation, when deciding whether to invest in this stock. We cover that in our actionable full research report which you can read here (it’s free).