Valued at a market cap of $20.2 billion, Omnicom Group Inc. (OMC) is a New York-based company that offers advertising, marketing, and corporate communications services.
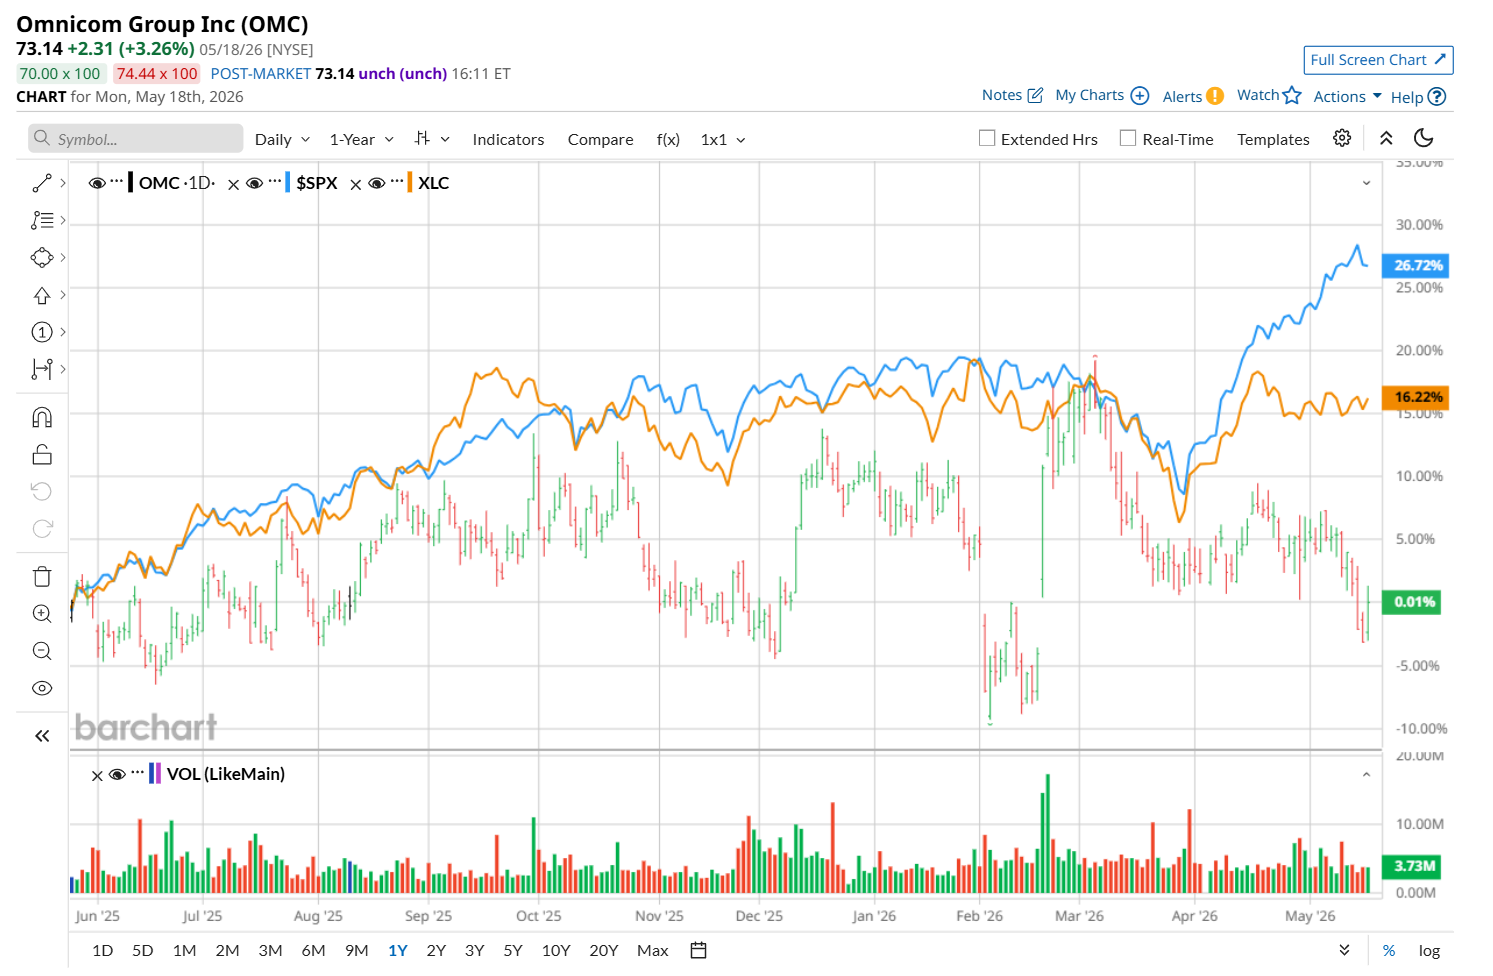
This advertising agency has considerably underperformed the broader market over the past 52 weeks. Shares of OMC have declined 5% over this time frame, while the broader S&P 500 Index ($SPX) has soared 24.3%. Moreover, on a YTD basis, the stock is down 9.4%, compared to SPX’s 8.1% rise.
Looking closer, OMC has also lagged the State Street Communication Services Select Sector SPDR ETF (XLV), which gained 14.9% over the past 52 weeks and declined marginally on a YTD basis.
On Apr. 28, OMC delivered its Q1 results, and its shares closed down marginally in the following trading session. The company’s revenue increased 69.2% year-over-year to $6.2 billion, while its adjusted EPS reached $1.90. The strong growth in both revenue and earnings was primarily driven by the completion of the Interpublic acquisition and the swift integration of its operations.
For the current fiscal year, ending in December, analysts expect OMC’s EPS to grow 26.8% year over year to $10.97. The company’s earnings surprise history is mixed. It exceeded the consensus estimates in two of the last four quarters, while missing on two other occasions.
Among the 11 analysts covering the stock, the consensus rating is a "Moderate Buy," which is based on five “Strong Buy,” five “Hold,” and one "Moderate Sell” ratings.
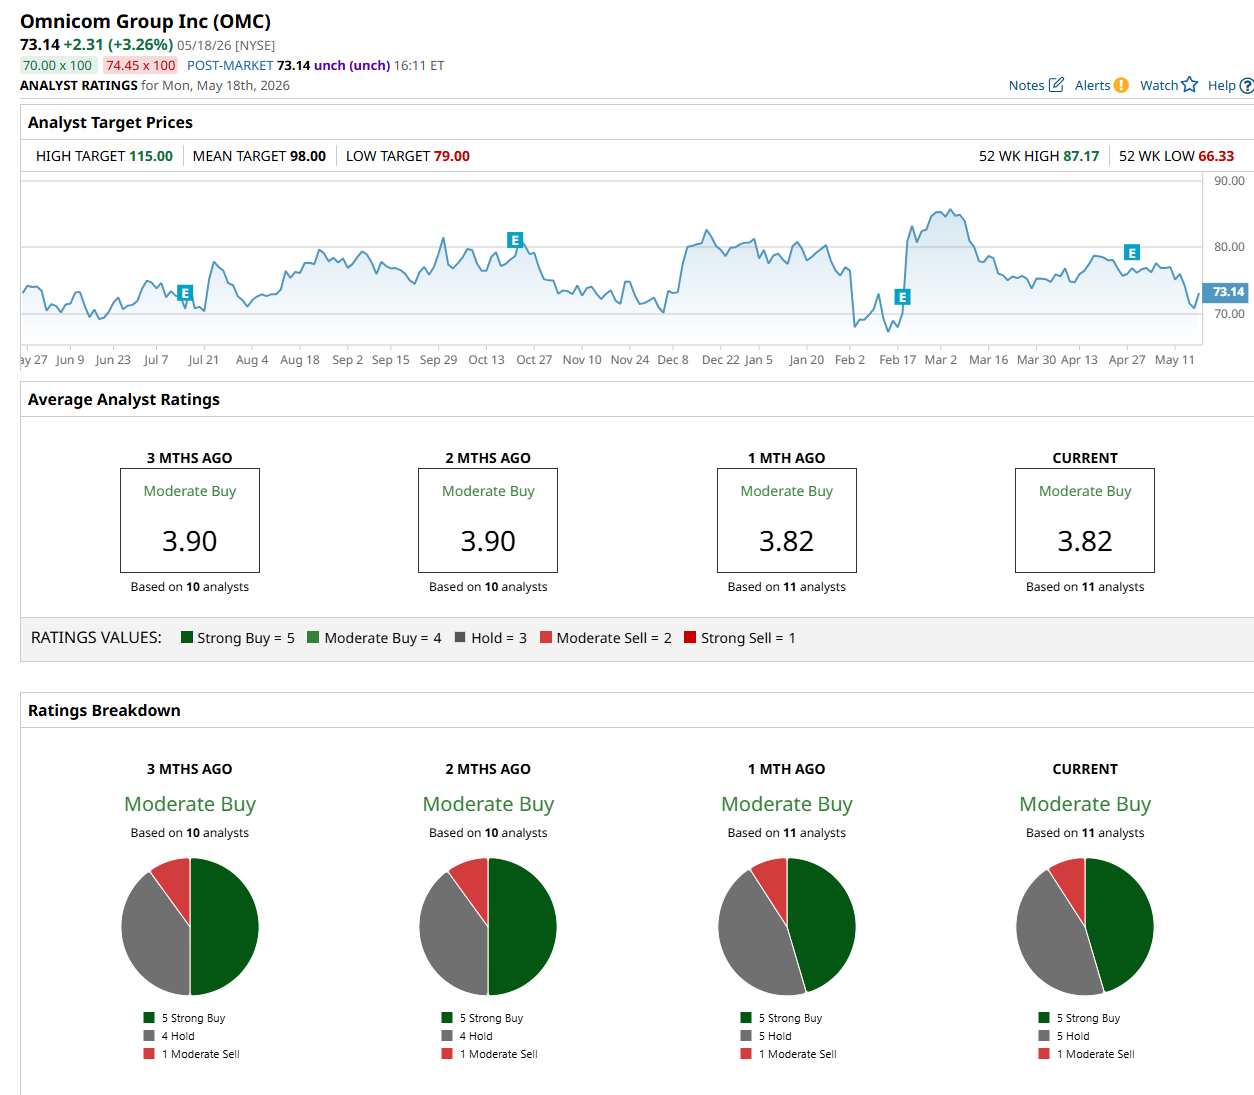
The configuration has remained fairly stable over the past three months.
On May 6, BofA analyst Adrien de Saint Hilaire maintained an “Underperform” rating on OMC and lowered its price target to $79, indicating an 8% potential upside from the current levels.
The mean price target of $98 suggests a 34% premium to its current price levels, while its Street-high price target of $115 implies a 57.2% potential upside.
On the date of publication, Neharika Jain did not have (either directly or indirectly) positions in any of the securities mentioned in this article. All information and data in this article is solely for informational purposes. For more information please view the Barchart Disclosure Policy here.
More news from Barchart
- Nvidia Just Proved ‘AI Efficiency’ Is Fake as Layoffs Rise: ‘The Cost of Compute Is Far Beyond the Cost of Employees’
- Gen Digital Stock Shows Unusual Call Options Volume - Are Investors Bullish?
- Dear Intuit Stock Fans, Mark Your Calendars for May 20
- Wall Street Is Loving the Layoffs at Microsoft. Buy the Dip.


